Differential Analysis Function in msFineAnalysis Ver 3 (2)
MSTips No.328: Analysis of Coffee Bean Aroma Component using Headspace-GC-TOFMS
Introduction
As the performance of mass spectrometers has improved, the demand for differential analysis of trace components in materials has increased. To address this trend, we have added a new differential analysis function to msFineAnalysis, our automated qualitative analysis software specifically designed for GC-HRTOFMS data. In this work we used msFineAnalysis to compare coffee bean aromas by using headspace (HS)-GC-MS. Additionally, the analysis results were consistent with the characteristics of the production area for the coffee beans.
Analysis detail
Two commercially available coffee beans (A: from Guatemala, B: from Brazil) were used as samples. The measurements were performed with the steps below.
- Put 1g of coffee beans in a 22mL HS vial, pour 15mL of boiling water to 100°C, and seal.
- Cool the sample vial to room temperature, collect 10mL of supernatant liquid, and add 2μL of the internal standard (p-Bromofluorobenzene).
- Separate the above into 2mL each for 5 HS vials and seal.
GC/EI measurements were performed for n=5 in order to conduct statistical analysis of the sample differences. The msFineAnalysis differential analysis conditions involved using p-value (an index: the smaller the p-value, the higher the statistical reproducibility) ≦5% and fold change (intensity ratio between samples) ≧1.5. Table 1 shows the measurements condition details.
Table 1. Measurement and analysis conditions
| HS-GC-MS | |
|---|---|
| Headspace sampler | MS62070STRAP (JEOL) |
| Mode | Trap |
| Sample heating | 60°C, 15min |
| Gas Chromatograph | 7890A GC (Agilent Technologies, Inc.) |
| Mode | Split mode (30:1) |
| Column | ZB-WAX (Phenomenex Inc) 30m x 0.18mm, 0.18μm |
| Oven Temperature | 40°C(3min)-30°C/min -250°C(10min) |
| Carrier flow | He, 1.0mL/min |
| TOFMS | JMS-T200GC(JEOL) |
| Ionization | EI+:70eV, 300μA FI+:-10kV, 48A Carbotec-5μm (CarboTech) |
| Mass Range | m/z 35-600 |
| msFineAnalysis | (JEOL) |
| Mode | Variance component analysis |
| Number of data | n=5 |
| p-value | ≦5% |
| Fold change | ≧1.5 |
Results
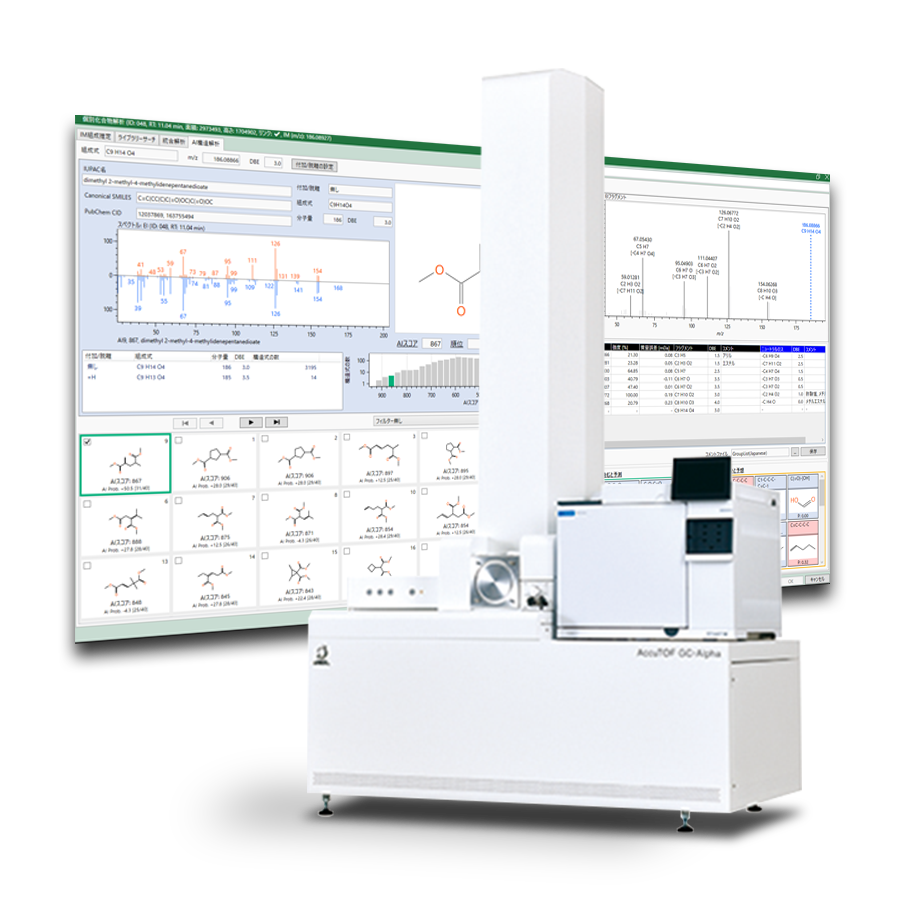
Figure 1 shows a screenshot of the differential analysis results for the coffee samples by using msFineAnalysis. In total, 141 peaks were detected. The breakdown of the differential peaks are: Sample A: 6 peaks that are characteristic of Guatemalan coffee aroma (peak ID[006:]furfural, [007]acetic acid, etc.), Sample B: 3 peaks that are characteristic of Brazilian coffee ([001] metylfuran, etc.), and 52 peaks that did not show a difference between Sample A and B. Additionally, there were 88 peaks that were judged to have no statistical reproducibility (gray in volcano plot, “other” in classification results).
From Sample A, the Guatemalan coffee, hexanal (aroma of grass), methyl acetate (fruit-like aroma), acetic acid, linalool (citrus/floral aroma) were strongly detected. These results are consistent with the freshness and crispness that are characteristics of the coffee beans from Guatemala. From Sample B, the Brazilian coffee, methylfuran (chocolate-like aroma), dimethyl disulfide (garlic-like aroma) were detected, which is consistent with the richness that is characteristic of coffee beans from Brazil.

Figure 1. Screenshot of msFineAnalysis
Figure 2 shows a screenshot of the data alignment (identity determination) of msFineAnalysis. Linalool is represented by a very minor peak with an intensity ratio of 0.68% to the maximum peak, and is likely to be missed by manual analysis. By using peak deconvolution detection, msFineAnalysis allows for the detection of minor peaks that are not obvious in the TICC . Furthermore, the statistical analysis of multiple measurements results in highly reliable qualitative analysis results by removing peaks from the analysis list that are not statistically reproducible.

Figure 2. Screenshot of alignment window
Summary
The differential analysis function of msFineAnalysis Ver3 enabled us to easily identify coffee bean aroma components that are consistent with the characteristic of the production region (Guatemalan versus Brazilian). As a result, msFineAnalysis offers sophisticated capabilities such as peak deconvolution and statistical analysis to effectively differentiate samples from each by using trace components such as an aromas for sample differentiation.
- Please see the PDF file for the additional information.
Another window opens when you click. 
PDF 933.3KB
Related Products

Are you a medical professional or personnel engaged in medical care?
No
Please be reminded that these pages are not intended to provide the general public with information about the products.