Quantitative Characterization of Magnetic Materials Based on Electron Magnetic Circular Dichroism with Nanometric Resolution Using the JEM-1000K RS Ultra-High Voltage STEM
JEOLnews Volume 49, Number 1, 2014
Shunsuke Muto1, Jan Rusz2, Kazuyoshi Tatsumi1, Roman Adam3, Shigeo Arai1,
Vancho Kocevski2, Peter M. Oppeneer2, Daniel E. Bürgler3 & Claus M. Schneider3
1Division of Green Materials, EcoTopia Science Institute, Nagoya University, Japan
2Department of Physics and Astronomy, Uppsala University, Sweden
3Peter Grünberg Institut, Forschungszentrum Jülich GmbH, Germany
Electron magnetic circular dichroism (EMCD) allows the quantitative, element-selective determination of spin and orbital magnetic moments in a manner similar to its better-established X-ray counterpart, X-ray magnetic circular dichroism (XMCD). As an advantage over XMCD, EMCD measurements are performed using transmission electron microscopes, which are routinely operated at sub-nanometer resolution. However, because of the low signal-to-noise ratio of the EMCD signal, it has not yet been successful to obtain quantitative information from EMCD signals at the nanometer scale. In the present article, we demonstrate a new approach to EMCD measurements that takes most of the higher accelerating voltage of the incident electrons, which considerably enhances the applicability of the technique. The statistical analysis introduced here yields robust quantitative EMCD signals. In the present scheme, quantitative magnetic information can be routinely obtained using electron beams of only a few nanometers in diameter, without imposing any restrictions on the crystalline order of the specimen.
Introduction
Electron microscopy, when used in combination with several types of spectrometers, provides not only magnified images with spatial resolutions down to the atomic scale but also local chemical information such as chemical composition and electronic states. In particular, electron energy-loss spectroscopy (EELS), which analyzes electrons transmitted through a sample, can be used to explore a rich variety of material properties. Its emerging significance in nanometric analysis is growing further, in competition with its counterpart, the X-ray absorption spectroscopy, measured at synchrotron X-ray sources.
Modern synchrot ron X-ray sources capable of delivering intense radiation with a well-defined polarization have provided insight into not only the structural and chemical but also magnetic aspects of solids [1]. The usefulness of synchrotron X-rays in magnetism can be attributed to the discovery of an important phenomenon called as X-ray magnetic circular dichroism (XMCD) [2-4]. XMCD originates from the dependence of the absorption cross-section on the sample magnetization with respect to the photon helicity. Spin and orbital magnetic moments can be quantitatively determined in an elementspecific manner using a simple integration of the XMCD spectra employing sum rules [5,6]. An analog to XMCD is the electron magnetic circular dichroism (EMCD) technique, in which electrons are transmitted through a magnetic sample in a transmission electron microscope (TEM) [7,8] . EELS measured at core levels in different positions in the diffraction plane can then be employed to extract element-selective magnetic information.
Since the possible existence of EMCD was first outlined in 2003 [7] using methods reminiscent of symmetry-selected EELS [9], recent theoretical and experimental progress in the EMCD technique has led to improvements in its spatial resolution [10,11], facilitated theoretical understanding [12-16] , and also given rise to the first quantitative studies [17- 19] of spin and orbital magnetic moments. Although TEM has been expected to of fer a much higher spatial resolution than that currently obtainable with XMCD, high-resolution quantitative EMCD has not yet been achieved, because of its inherent low net signal strength. Because EMCD is measured at corelevel edges, the signal strength exhibits a power-law decay as a function of energy loss. Another challenge is the necessity to measure EMCD at diffraction angles that do not coincide with Bragg spots in the diffraction plane, which reduces the signal strength even further. Moreover, beam and sample instabilities, coupled to a potential damage of the sample by an intense electron beam, limit the acquisition time. In most experiments performed to date, a large beam current was used in an optimized geometry—namely, the 2-beam [8,14,17,20,21] or 3-beam [11,17,19,22] Bragg condition—which in turn necessitates the use of a single-crystalline specimen in a precise and stable orientation.
In our recent article [23], we had introduced a new scheme for measuring EMCD by utilizing an ultra-high voltage scanning transmission electron microscope (UHV-STEM) equipped with EELS. The conventional procedure of optimizing the signal-tonoise ratio (SNR) in a fixed geometry is inherently prone to beam damage and stability issues. Therefore we rapidly collected a large number of independent spectra and, in addition, introduced a new statistical technique for the analysis, efficiently overcoming the aforementioned restrictions and reducing the lateral resolution of quantitative EMCD to the nanometer range. The power of the technique was demonstrated by analyzing a polycrystalline iron sample [23].
Theoreticalback ground and simulation
The underly ing idea for the measurement scheme involves the decomposition of the inelastic transition matrix elements (mixed dynamic formfactor; MDFF) using a dipole approximation into a linear combination of non-magnetic and magnetic terms, including their anisotropies [15]. In a material with a cubic crystal structure, such as bcciron, the anisotropic terms are negligible, and a simple expression for the MDFF S(q, q' , E) remains:

where q and q’ are momentum transfer vectors, E is the energy loss, and N(E), MZ (E) are the whiteline non-magnetic signal and magnetic EMCD signal, respectively. In this equation, it has been assumed that the sample is magnetically saturated along the z-axis in the magnetic field of the objective lens.
At an arbit rar y relat ive or ientat ion of the crystalline axes, incoming beam, and detector, the scattering cross-section ∂2(E,Ω ) / ∂E∂Ω will be a weighted sum, as given below:
where A(Ω) and B(Ω) are coefficients that depend on the diffraction angle Ω . Consequently, we establish that for a bcc-iron polycrystalline sample with sufficiently large grains, every spectrum is a linear combination of a white-line non-magnetic signal N(E) and a magnetic EMCD signal MZ (E), albeit with a priori unknown coefficients A(Ω) and B(Ω).
On the basis of the theoretical method outlined above, we per formed simulat ions to obtain the dichroic signal distribution in the diffraction plane for a randomly oriented polycrystalline sample. A bcc iron supercell of 4 × 4 × 18 lattice dimensions (approximately 1 nm × 1 nm × 5 nm) containing 576 iron atoms was melted, annealed, and slowly cooled in accordance with classical molecular dynamics, considering the interatomic potential proposed by Mendelevetal. [24] . The procedure was repeated multiple times, and in some cases, we obtained a model structure with several crystalline grains of different orientations (Fig.1(a)). The corresponding electron diffraction pattern is presented in Fig. 1(b). We calculated the electronic structure of this model structure using density functional theory and estimated an average magnetization of 2.19 μB per atom. For calculations of the dynamical diffraction, this model structure was periodically repeated in the x, and y dimensions and illuminated by a plane wave. The calculated Fe-L3 edge energyfiltered diffraction pattern of the magnetic signal along the z-direction [16] is presented in Fig. 1(c). Approximately 600 beams were considered in the simulation [12,25]. The approach proposed in this article has been inspired by simulated distributions of dichroic signals in the diffraction plane [12,15], which suggest t hat EMCD is present almost everywhere in the diffraction plane, despite nontrivial variations in strength and sign.
![Fig. 1 (a) Model bcc Fe polycrystalline supercell produced by a classical molecular dynamics simulation. (b) Calculated electron diffraction pattern of the cell. (c) The theoretical EMCD signal intensity distribution (along z-direction [18]) in the diffraction plane (1 mrad ~ 0.25 g110 ~ 1.25 nm-1).](./product_file/file/e49_03-fig1.jpg)
Fig. 1 (a) Model bcc Fe polycrystalline supercell produced by a classical molecular dynamics simulation. (b) Calculated electron diffraction pattern of the cell. (c) The theoretical EMCD signal intensity distribution (along z-direction [18]) in the diffraction plane (1 mrad ~ 0.25 g110 ~ 1.25 nm-1).
Experimental
A 30 -nm- thick bcc iron layer and a 3 -nmthick Al cap layer ( to prevent the oxidation of Fe) were deposited on 50-nm-thick Si3N4 membranes by thermal evaporation in an ultrahigh vacuum molecular beam epitaxy (UHVMBE) system. The disordered structure of the membranes (nanocrystalline or amorphous) led to a polycrystalline morphology of the metallic Fe/Al films. Air exposure after the deposition oxidized the Al cap layer to a depth of 1.5 to 2 nm. Because the Al layer was 3-nm thick, a closed AlOx layer was maintained even in the presence of surface roughness, as is likely for a polycrystalline film. The grain size was ~30 nm, which is comparable to the thickness of the iron layer (Fig. 2(a)).
Because oxidation of the iron film could have substantial effects on the intensity ratio of the L3 and L2 edges [26], the film was examined with EELS to probe if any oxidation of the iron occurred before or after the EMCD measurements. This was achieved by taking advantage of the fact that the oxygen K edge can be easily distinguished between aluminum and iron oxides. Nevertheless, no iron oxides were observed within the detection limit of EELS (< 1 at %).
The measurements were performed using EELS spectral imaging with an ultra-high voltage scanning transmission electron microscope (UHV-STEM), the JEOL JEM-10 0 0K RS of Nagoya University (Fig. 2(b)). The STEM was operated at 1 MV, and it was equipped with an equivalent Gatan Image Filter (GIF) Quantum specially designed for this accelerating voltage. The sample was heated to 200 °C during the experiment so that measurements were contamination-free. The full width at half maximum (FWHM) of the zero-loss peak (ZLP) was ~2.6 eV because the beam current had been increased to ensure an increase in spectral counts.
A schematic diagram of our experimental setup is presented in Fig. 3. The electron beam was focused to ~5 nm, and the sample was scanned with 15 × 15 pixels with a scan step of 20 nm. This configuration ensured that the electron beam illuminated random grains, typically one or a few grains at each scanned position. The convergence semiangle of the probe was ~1 mrad. EELS spectra were recorded with a dispersion of 0.5 eV/channel, exposure time of 30 s for each spot, and a collection semiangle of ~1 mrad. The detector aperture was placed adjacent to the transmitted beam in the diffraction plane to avoid including the intense transmitted beam. Under these conditions, the Fe-L3 peak intensities ranged between 8,000 and 12,000 counts per spectrum. The same experiment was repeated independently for three different areas.
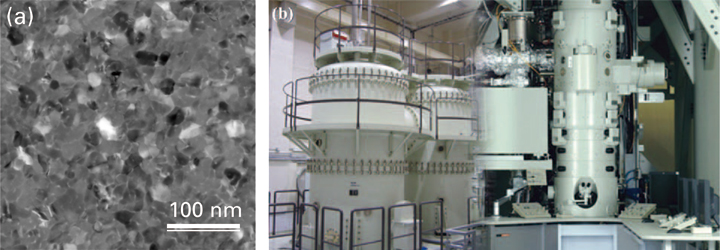
Fig. 2 (a) TEM image of the present polycrystalline Fe film. (b) Photograph of the UHV-STEM JEM-1000K RS at Nagoya University.
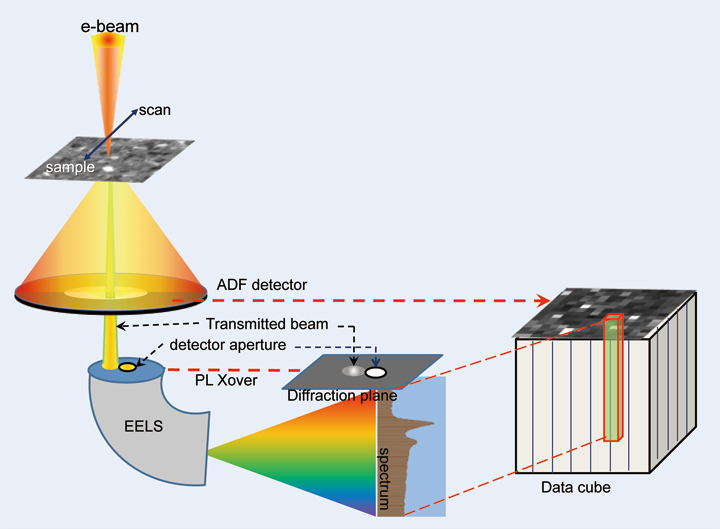
Fig. 3
Schematic drawing of the present experimental setup and the data obtained (ADF: annular dark field, PL: projector lens).
Calculated net
Results
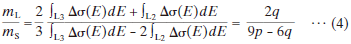
The acquired dataset forms the starting point for our statistical procedure leading to the extraction of the EMCD spectrum. In the measurement, we use an ultra-high-voltage (1 MV) electron beam to significantly reduce the effect of multiple scattering, which could otherwise distort the EMCD signal [18,19,27]. Our theoretical simulations indicate that the net EMCD signal at an accelerating voltage of 1 MV is ~20% larger than that obtained at 200 kV for a specimen thickness between 25 and 40 nm [28], as shown in Fig. 4.
The obtained spectral image data-cubes were first treated by aligning the drifted peak positions and removing X-ray spikes (very bright/dark spots). We then applied the pre-edge background subtraction to extract the Fe-L2,3 peaks, after which we applied a low-pass filter with a window width that was variable from 3.5 to 10 eV.
We did not apply the Fourier - ratiode - convolution to remove the plural scattering effect, because the plasmon peak-to-zero loss peak intensity ratio was less than 6%, causing only a negligible difference to the final mL/mS ratio within the experimental accuracy [18]. The reduced size of the error, attributed to the multiple scattering, is another advantage of using a megavolt-STEM in addition to the improved strength of the EMCD signal compared with lower acceleration voltages, as more explicitly discussed in [28].
Each measured spectrum was normalized by scaling the post-edge intensity, integrated over the range 740 –750 eV, to one. The effect of this normalization on the quantitative analysis was discussed in a previous study [29]. In the first step, we examined the difference spectra for all pairs of the spectra in the dataset. As described above, each spectrum can be considered as consisting of two components, a magnetic one (the EMCD) and a nonmagnetic one. When a spectrum is acquired in a random orientation, the weight of each component i s also random; however, once the spectra are background-subtracted and normalized post-edge (where the magnetic component is always zero), the nonmagnetic component will be identical in every spectrum and will therefore be eliminated by taking the difference spectrum.
After pre-processing the 225 measured spectra in each dataset, we calculated a difference spectrum for every pai r of spectra present in the dataset, which yielded a total of 25,200 difference spectra per dataset. Each of the difference spectra were subsequently examined for the presence of an EMCD signal using criteria that probe the relative signs of intensity around the L3 and L2 edges:
where ∫L3 Δσ dE represents the EMCD signal intensity integrated over the Fe-L3 peak region and IΔσ (at L3 peak) denotes the EMCD signal value at the L3 peak position. All the difference spectra that met our selection criteria were first adjusted in sign such that the L3 signal was positive (cf., Fig. 7(a)) and then summed. Of the entire set, approximately 20–25% of the pairs always displayed signs of the EMCD signal and thus met our selection criteria. The selected subset (~ 5,000 difference spectra) or iginated f rom more than 100 independent raw spectra among the entire set of 225 spectra, which ensures that the statistical noise is reduced by a factor of 10 compared to the average noise of individual raw spectra.
The final summed signal intensities and profiles for the three datasets were nearly identical (see Fig. 5(a)). Minor differences were observed in the preedge and post-edge background regions, which were related to varying fluctuations between individual datasets. These differences can be attributed to inaccuracies in the extraction of the power-law background signal, which is caused by extrapolation from a noisy pre-edge signal.
We averaged the three accumulated EMCD signals to obtain the final EMCD spectrum, which is presented in Fig. 6. The EMCD signal intensity fraction was estimated to be 2–2.3% of the Fe-L2,3 signal intensity (Fig. 5(b)), which is consistent with the theoretical estimate (see Fig. 4). The final EMCD signal is a result of averaging over ~15,000 different spectra and was thus observed to be statistically robust.
After extraction of an EMCD signal with a good SNR, the EMCD sum rules [12] were applied to the signal to evaluate the orbital moment/spin moment ratio, which is given by [13,14]:
where q is an energy integral of the EMCD spectrum (E) over both edges and p is an energy integral over the L3 edge only. Without loss of generality, we can rescale the EMCD spectrum or its integral such that p = 1 (Fig. 6(a)). Thus, the orbital to magnetic moment ratio mL/mS becomes a function of q only. The application of the low-pass filter can possibly lead to the overlap and cancellation of the EMCD signals of the L3 and L2 peaks, which could equally reduce the magnitude of both peaks and consequently enhance the effect of their difference. Moreover, the application of the low-pass filter can affect the post-edge normalization [29]. The latter could alter the mL/mS ratio determined using the sum rules. The mL/mS ratio was hence plotted as a function of the low-pass filter window width, as illustrated in Fig. 6(b). The minimal and maximal q values were extracted from the post-edge region between 740-750 eV energy loss, from which the minimal and maximal mL/mS were calculated. In Fig. 6 (b) , the mL/mS values with er ror bars are plotted as the middle points of these upper and lower bounds. The shaded area is bounded by linear regression lines (grey solid lines) at the lower and upper bound values. The final mL/mS was evaluated to be the intercept of the linear regression line (grey broken line) of the middle points +/- half of the interval defined by the intercepts of the bound lines. By linear extrapolation to zero filter width, we finally obtained mL/mS = 0.0429 ± 0.0075, which is in good agreement with the value obtained by XMCD for bcc iron, 0.043 [3]. To our knowledge, this result is the first quantitative EMCD detection performed on a polycrystalline film.
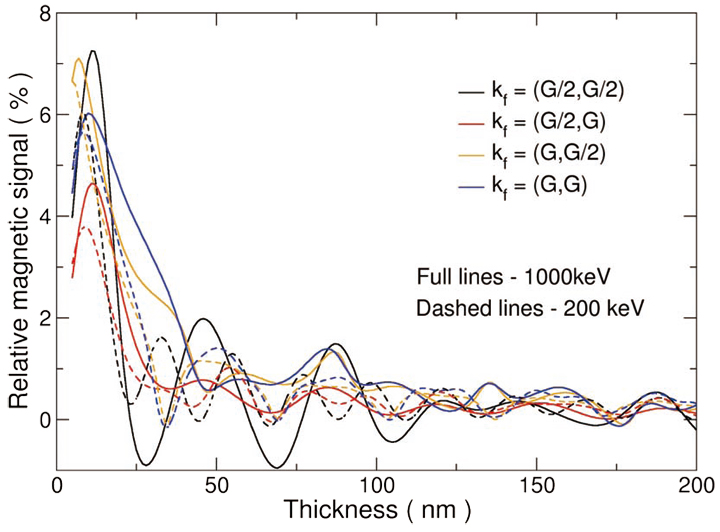
Fig. 4 Schematic drawing of the present experimental setup and the data obtained (ADF: annular dark field, PL: projector lens). Calculated net EMCD signal at accelerating voltages of 200 kV and 1 MV on the Fe-L3 peak, with respect to its peak height, for a bcc single crystal Fe. Here, the incident beam is parallel to the <1¯1 8> and the 110 systematic row is excited. Each solid line corresponds to the case of the center of the Laue circle indicated in the legend, in units of G, where G = (110) is a Bragg reflection defining the systematic row orientation.
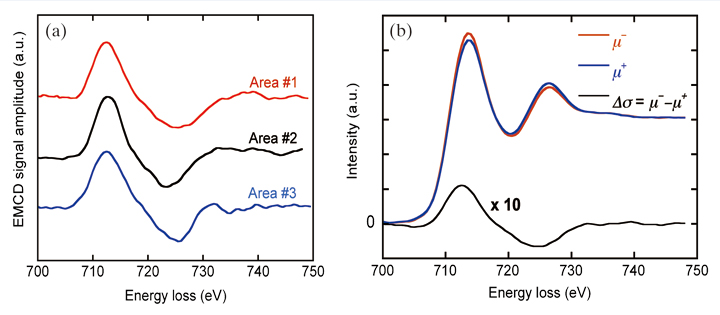
Fig. 5 Representative EMCD spectra measured on a fine-grain polycrystalline Fe film by STEM-EELS at an accelerating voltage of 1 MV, in the case where a 5-eV low-pass filter is applied to the original spectra. (a) EMCD signals extracted during three independent trials, from different areas of the sample. (b) A pair of Fe-L2,3 spectra (μ+ and μ−) extracted from the dataset and the difference spectrum (EMCD signal) Δ σ = μ− −μ+.
Fig. 6 (a) The averaged EMCD signal (red dots) and its cumulative sum (black line), evaluated, in order to apply the sum rule. (b) Plot of mL /mS estimated by the sum rule, as a function of the window width of the low-pass filter used for data smoothing.
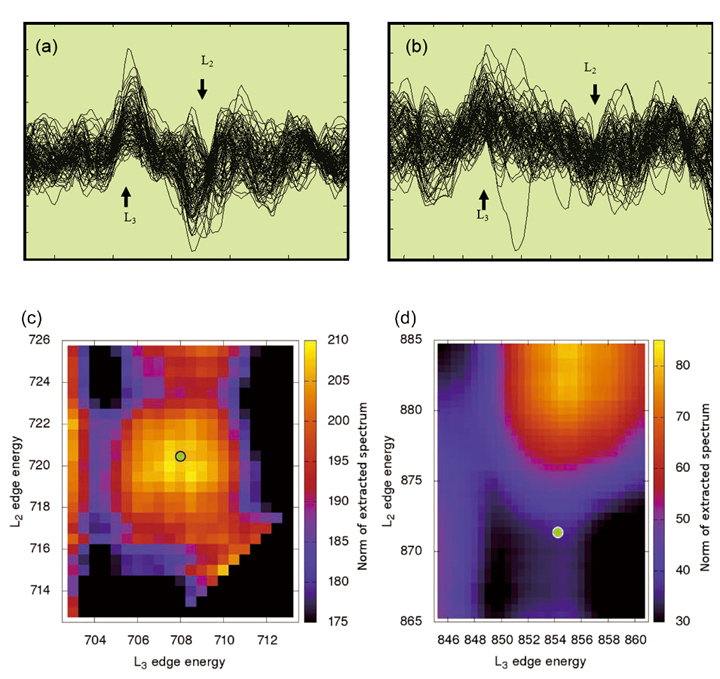
Fig. 7 (a) Example of the difference spectra for a polycrystalline bcc iron film. Only spectra that met the criteria (Eq. (3)) are shown, after being aligned in sign. (b) Same as (a) but for a polycrystalline NiO film. The arrows indicate the L3 and L2 peak positions of the raw spectra. Note the different scale of the vertical axes relative to the post-edge normalized spectra, considering that all raw spectra were normalized to 1 in the post-edge region. (c) Maps of the norm of the extracted averaged spectrum, as a function of the L2 and L3 edge energies for the polycrystalline bcc iron sample (see Discussion). (d) Same as (c) but for the antiferromagnetic NiO film. The green circles indicate experimental edge energies. Note again the different scale of the norms.
Discussion
The main error source for our extraction method of the EMCD spectrum stems from the imperfection of the employed detectors: the recorded raw spectra may include significant fractions of systematic errors that originate from instrumental instabilities and concomitant intrinsic l imitations, in addition to statistical random noise.
For the reasons stated above, we observed that conventional statistical signal extraction methods, such as the one based on multivariate curve resolution technique [29], were not efficient. It was rather essential that the data are first sorted so that only the data sets containing significant signal levels are selected on the basis of the selection criteria (Eq. (3)) applied to the difference spectra.
To eliminate the possibility that our procedure might lead to a fake EMCD-like signal profile extracted from a random noisy data array, we performed an equivalent set of measurements on an antiferromagnetic NiO film, from which no EMCD signal was expected because of the cancellation of magnetic signals from symmetrically equivalent atoms with antiparallel moments. The sample was a NiO polycrystalline film (grain size ~ 30 nm, film thickness ~ 30 nm), and the measurements were performed under the same conditions (at 165°C, which is below the Néel temperature) as for the bcc iron film. Subsequently, the same data processing procedure was applied to the Ni L2,3 white-line spectra.
The noise level was estimated by taking the square-root of the sum of squares of the difference spectra between the raw and median filtered (averaged over every 10 channels) spectra divided by the number of channels used for the analysis. Then, the SNR was estimated by dividing the intensity at the L3 peak position of the averaged EMCD signal by the noise level. The estimated SNR was 2-3 for bcc iron, whereas it was less than 0.5 for NiO. The averaged signal extracted from the NiO data was actually observed to exhibit a bimodal EMCD-like profile; however, the profile significantly varied upon changing the integration width for the first selection criterion. Additionally, the q-value from the sum rule was sometimes positive and sometimes negative, without a clear trend with respect to the filter width. The bimodal profile is a result of the select ion requirements (Eq. (3)), which extract all EMCD-like difference-spectra naturally occurring in the set of completely random difference-spectra. However, the signal profiles extracted from the iron film exhibited a stable feature. The situation can be best observed from the overlaid typical difference spectra meeting the selection criteria for the two cases, as shown in Fig. 7(a) and (b). For the iron film, one can clearly recognize an approximate EMCD signal profile, whereas for the NiO film, the spectra visually differ only slightly from random noise.
As an additional test of the statistical robustness of the polycrystalline iron EMCD result , in contrast to the averaged NiO signals originating from noise, we varied the L2,3 peak energies in the neighborhood of their experimental values in our extraction procedure. At every combination of the L2,3 peak energies, an averaged EMCD-like signal was constructed. For every extracted signal, we calculated its norm as a sum of squares within the edge integration intervals. If a true EMCD signal was present in the data, this sum of squares would have a local maximum near the physically correct values of the peak energies.
Fig. 7(c) and (d) present maps of the norms calculated for a median filter of 7 eV and an integration range ±5 eV around the assumed peak energies, with the L3 energy as its abscissa and the L2 energy as its ordinate. A green circle denotes the position of the L3/L2 peak energies, where the experimental white-line spectra exhibit maximal counts. The striking difference between the two plots clearly demonstrates the validity of our method. The polycrystalline iron data reveal a distinct peak around the expected values of the peak energies, with a maximum within 1 eV of the experimental values. Conversely, the NiO spectra do not exhibit any such feature around the expected peak energies.
Conclusion
In this article we demons t rated a method utilizing UHV- STEM-EELS, that leads to statistically significant EMCD spectra. We emphasize that, even though a 5-nm nanoprobe was used, the spectral differences were computed from the entire data stack, rendering the effectively sampled area to be of the order of 100 nm. This area could be reduced by changing the scanning pattern, provided that sufficiently random orientations were included in each dataset. Consequently, our approach allows quantitative EMCD studies of non-single crystalline samples at the nanoscale, and hence paves the way for a wide range of applications of EMCD experiments in the field of nano-magnetism.
Acknowledgments
We are very grateful to the engineers , in particular Drs. M. Ohsaki and S. Ohta, of JEOL Ltd. for their dedicated efforts in building the new UHV-STEM at Nagoya University. A part of this work was supported by a Grant-in-Aid on Innovative Areas "Nano Informatics" (grant number 25106004) from the Japan Society of the Promotion of Science, Swedish Research Council, and STINT.
References
[ 1 ] Stöhr, J. & Siegmann, H., Ch. Magnetism: From fundamentals to Nanoscale Dynamics. Springer, ISBN 978-3-540-30283-4 (2006).
[ 2 ] Erskine, J. L. & Stern, E. A., Phys. Rev. B 12, 5016- 5024 (1975).
[ 3 ] Schutz, G., Wagner, W., Wilhelm, W., Kienle, P., Zeller, R., Frahm, R. & Materlik, G., Phys. Rev. Lett. 58, 737-740 (1987).
[ 4 ] Chen, C. T., Idzerda, Y. U., Lin, H-J., Smith, N. V., Meigs, G., Chaban, E., Ho, G. H., Pellegrin, E. & Sette, F., Phys. Rev. Lett. 75, 152-155 (1995).
[ 5 ] Thole, B T., Carra, P., Sette, F. &. van der Laan, G., Phys. Rev. Lett. 68, 1943-1946 (1992).
[ 6 ] Carra, P., Thole, B. T., Altarelli, M. & Wang, X., Phys. Rev. Lett. 70, 694-697 (1993).
[ 7 ] Hebert, C. & Schattschneider, P., Ultramicroscopy 96, 463-468 (2003).
[ 8 ] Schattschneider, P., Rubino, S., Hébert, C., Rusz, J., Kunes, J., Novák, P., Carlino, E., Fabrizioli, M., Panaccione, G. & Rossi, G., Nature 441, 486-488 (2006).
[ 9 ] Batson, P., Phys. Rev. Lett. 70, 1822-1825 (1993).
[10] Schattschneider, P., Hébert, C., Rubino, S., Stoeger- Pollach, M., Rusz, J. & Novák, P., Ultramicroscopy 108, 433-438 (2008).
[11] Schattschneider, P., Stoeger-Pollach, M., Rubino, S., Sperl, M., Hurm, Ch., Zweck, J. & Rusz, J., Phys. Rev. B 78, 104413 (2008).
[12] Rusz, J., Rubino, S. & Schattschneider, P., Phys. Rev. B 75, 214425 (2007).
[13] Rusz, J., Eriksson, O., Novák, P. & Oppeneer, P. M., Phys. Rev. B 76, 060408(R) (2007).
[14] Calmels, L., Houdellier, F., Warot-Fonrose, B., Gatel, C., Hÿtch, M. J., Serin, V., Snoeck, E. & Schattschneider, P., Phys. Rev. B 76, 060409(R) (2007).
[15] Rusz, J., Rubino, S., Eriksson, O., Oppeneer, P. M. & Leifer, K., Phys. Rev. B 84, 064444 (2011).
[16] Rubino, S., Schattschneider, P., Rusz, J., Verbeeck, J. & Leifer, K., J. Phys. D: Appl. Phys. 43, 474005 (2010).
[17] Lidbaum, H., Rusz, J., Liebig, A., Hjörvarsson, B., Oppeneer, P. M., Coronel, E., Eriksson, O. & Leifer, K., Phys. Rev. Lett. 102, 037201 (2009).
[18] Rusz, J., Lidbaum, H., Rubino, S., Hjörvarsson, B., Oppeneer, P.
お問い合わせ
日本電子では、お客様に安心して製品をお使い頂くために、
様々なサポート体制でお客様をバックアップしております。お気軽にお問い合わせください。