Single-molecule atomic-resolution real-time TEM imaging
EM058
These data are direct microscopic observations of the structural changes of molecules in situ using single-molecule atomic-resolution real-time TEM (SMART-TEM) imaging method. Atomic-resolution TEM observations were carried out on JEM-ARM200F equipped with an image-forming aberration corrector.
Direct Microscopic Observation of Conformational Change of a Single Organic Molecule
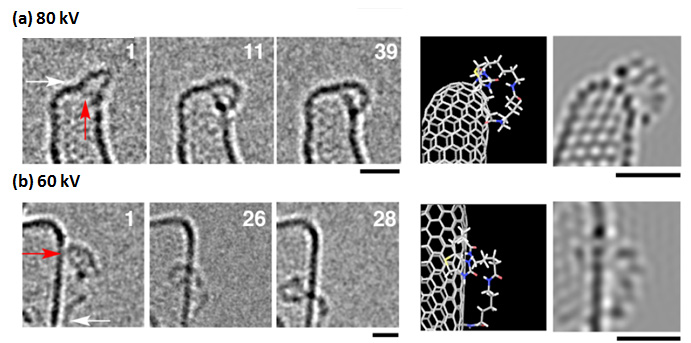
Figure 1. Representative images of molecule 1 extracted from TEM movies at different acceleration voltages. A plausible molecular model and its simulated TEM image are shown for molecule 1. The number refers to the frame number sequentially numbered from the beginning of the imaging. The red arrow points to the biotin terminal and the white arrow to the amide group connected to the CNH. Scale bars are 1 nm. Simulation images were generated by a multislice procedure implemented using standard simulation software.
(a) Molecule 1 is seen to be static at 80 kV. Irradiated for 47 s with a total electron dose of 6.1 × 10⁷ e− nm−2. (b) Rapidly moving 1 at 60 kV. Irradiated for 12 s with a total electron dose of 3.6 × 10⁵ e− nm−2.
Adapted with permission from J. Am. Chem. Soc. 2015, 137, 3474-3477. Copyright 2015 American Chemical Society.
Direct Microscopic Observation of Individual C60 Dimerization
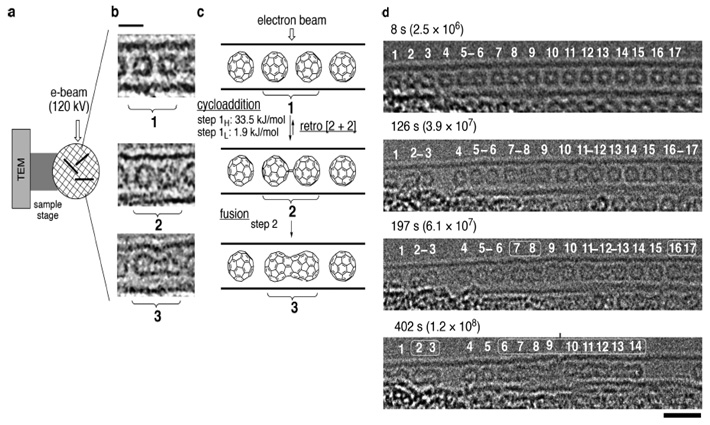
Figure 2. SMART-TEM imaging of the dimerization of C60@CNT.
(a) Schematic illustration of the experiments using C60@CNTs on a temperature-controlled microgrid. (b) TEM images of intermediates in a 1.4 nm CNT. The scale bar is 1 nm. (c) Four types of reactions observed using TEM. (d) Steps 1H and 2 seen for 17 molecules at 443 K under 120 kV acceleration voltage and with an electron dose rate (EDR) of 3.1 × 10⁵ e− nm−2 s−1. Numbers in parentheses denote total electron dose (TED) of each frame with the unit of e− nm−2. A [2+2] cycloadduct is indicated as hyphenated numbers, and a fused oligomer as boxed numbers. A defect is shown with a red arrow. The scale bar is 2 nm. The original movie is in the Supporting Information (Movie_S1.avi).
Adapted with permission from J. Am. Chem. Soc. 2017, 139, 18281-18287. Copyright 2017 American Chemical Society.
♦上のボックスの "再生"ボタンをクリックすると、ムービーが開始されます(1分間)♦
※These data courtesy of Profs. Eiichi Nakamura and Koji Harano, The University of Tokyo
- このページの印刷用PDFはこちら。
クリックすると別ウィンドウが開きます。 
PDF 720.7KB