同一カラムによるVOC、カビ臭気原因物質、エピクロロヒドリン、スチレン、 1,2,3-トリクロロベンゼンの分析
MSTips No.334
1.はじめに
水道の水質検査においては、ヘッドスペース-GC/MS法が複数の項目において、検査方法として採用されているが、測定に使用する機器構成の違いにより、1台の装置で異なる項目を測定する際には、カラム交換等が必要となるケースが殆どである。
今回、液相に(6%-シアノプロピル-フェニル)-メチルポリシロキサンを採用した低/中極性カラムDB-1301(長さ60m,内径0.32mm,膜厚1μm)を使用して、水質基準項目の揮発性有機化合物(→以後、VOCと省略) 、カビ臭気原因物質である2-メチルイソボルネオール(→以後、2-MIBと省略) 、ジェオスミンの3項目、要検討項目のエピクロロヒドリン、スチレン、1,2,3-トリクロロベンゼンの3項目を、それぞれ機器パラメーターのみ変更して測定する方法について検討し、検量線の直線性、下限濃度における再現性等について確認したので結果を報告する。
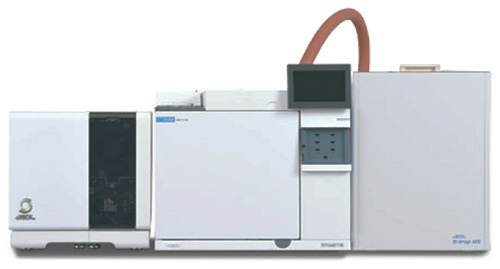
JMS-Q1500GC with MS-62070STRAP
2.測定概要
2.1.サンプル調製
VOC・2-MIB・ジェオスミンのサンプルは、4.5gの塩化ナトリウムと精製水10mLを量り入れたヘッドスペース用バイアルに、1,4-ジオキサンを除くVOCを0.1, 0.2, 0.5, 1, 2, 5, 10ppb、1,4-ジオキサンを1, 2, 5, 10, 20ppb、2-MIBとジェオスミンを1, 2, 5, 10, 20pptとなるよう添加し、調整した。内部標準物質は、各測定試料にフルオロベンゼンとp-ブロモフルオロベンゼンを5ppb、1,4-ジオキサン-d8を200ppb、2,4,6-トリクロロアニソール-d3を20pptの濃度になるよう添加した。
エピクロロヒドリン・スチレン・1,2,3-トリクロロベンゼンのサンプルは、精製水10mLを量り入れたヘッドスペース用バイアルに、エピクロロヒドリンを0.04, 0.08, 0.2, 0.4, 0.8ppb、スチレンと1,2,3-トリクロロベンゼンを0.1, 0.2, 0.5, 1, 2, 5, 10ppbとなるように添加し、調整した。内部標準物質は、各測定試料にフルオロベンゼンとp-ブロモフルオロベンゼンが5ppbの濃度になるよう添加した。
2.2.測定条件
サンプルの測定条件をTable1、SIMのモニターイオンについては、Table2に示した。測定条件のうち、相対EM電圧については、成分毎に検量線の濃度範囲が大きく異なるため、溶出成分に応じて変更した。VOC・2-MIB・ジェオスミンとエピクロロヒドリン・スチレン・1,2,3-トリクロロベンゼンをそれぞれ測定する際の相対EM電圧の設定及びSIMモードにおける各対象化合物の取り込み範囲をFigure1及びFigure2に示した。尚、各条件における測定対象成分の溶出位置把握のため、最も濃度の高いサンプルを測定した際のSIMクロマトグラムも併せて示した。
Table 1. Measurement condition
| Parameter | Value | ||
|---|---|---|---|
| HS | Sampling mode | Trap | |
| Sampling times | 3 | ||
| Sample temp. | 70°C | ||
| Sample heating time | 30min | 10min | |
| Trap tube | AQUATRAP1(GL Science, Inc) | ||
| Desorb temp. | 230°C | ||
| GC | Column | DB-1301(Agilent Technologies, Inc.), 60m×0.32mm id, 1μm film thickness | |
| Oven temp. | VOC, 2-MIB, Geosmine 40°C for 3min, to 100°C at 5°C/min, to 250°C at 10°C/min, and hold for 5min |
Epichlorohydrin, Styrene, 1,2,3-Trichlorobenzene 40°C for 3min, to 100°C at 5°C/min, to 250°C at 20°C/min, and hold for 3min |
|
| Carrier gas | 83.44kPa(Constant Pressure) | ||
| MS | Interface temp. | 250°C | |
| Ion source temp. | 250°C | ||
| Ionization current | 50μA | ||
| Ionization Energy | 70eV | ||
| Acquisition mode | pd-SIM | SIM | |
Table 2. SIM Monitor Ion of each compound
| # | Name | R.T. | Monitor ion(m/z) | ||
|---|---|---|---|---|---|
| 1 | 1,1-Dichloroethylene | 6.14 | 96 | 98 | 61 |
| 2 | Dichloromethane | 6.76 | 49 | 84 | 86 |
| 3 | t-Butyl Methyl Ether | 7.23 | 73 | 57 | |
| 4 | trans-1,2-Dichloroethylene | 7.08 | 96 | 98 | 61 |
| 5 | cis-1,2-Dichloroethylene | 8.54 | 96 | 98 | 61 |
| 6 | Chloroform | 9.05 | 83 | 85 | 47 |
| 7 | 1,1,1-Trichloroethane | 9.41 | 97 | 99 | 61 |
| 8 | Carbon Tetrachloride | 9.70 | 117 | 119 | 121 |
| 9 | 1,2-Dichloroethane | 10.03 | 62 | 64 | 49 |
| 10 | Benzene | 10.02 | 78 | 77 | 52 |
| 11 | Trichloroethylene | 11.22 | 130 | 132 | 95 |
| 12 | 1,2-Dichloropropane | 11.67 | 76 | 62 | 63 |
| 13 | Bromodichloromethane | 12.24 | 83 | 85 | 47 |
| 14 | 1,4-Dioxane | 11.95 | 88 | 58 | |
| 15 | cis-1,3-Dichloropropene | 13.22 | 49 | 77 | 75 |
| 16 | Toluene | 13.99 | 91 | 92 | 65 |
| 17 | trans-1,3-Dichloropropene | 14.53 | 75 | 77 | 49 |
| # | Name | R.T. | Monitor ion(m/z) | ||
|---|---|---|---|---|---|
| 18 | 1,1,2-Trichloroethane | 14.96 | 83 | 97 | 61 |
| 19 | Tetrachloroethylene | 15.29 | 166 | 164 | 129 |
| 20 | Dibromochloromethane | 15.89 | 129 | 127 | 131 |
| 21 | m-Xylene & p-Xylene | 17.87 | 106 | 91 | |
| 22 | o-Xylene | 18.75 | 91 | 106 | |
| 23 | Bromoform | 19.15 | 173 | 171 | 175 |
| 24 | p-Dichlorobenzene | 22.34 | 146 | 148 | 111 |
| 25 | 2-Methylisoborneol | 26.48 | 108 | 107 | 95 |
| 26 | Geosmin | 30.45 | 112 | 111 | 125 |
| 27 | Epichlorohydrin | 13.04 | 49 | 62 | 57 |
| 28 | Styrene | 18.22 | 104 | 103 | 78 |
| 29 | 1,2,3-Trichlorobenzene | 23.87 | 180 | 182 | 184 |
| 30 | Fluorobenzene | 10.52 | 96 | 70 | |
| 31 | 1,4-Dioxane-d8 | 11.84 | 96 | 64 | |
| 32 | p-Bromofluorobenzene | 19.88 | 95 | 174 | 176 |
| 33 | 2,4,6-Trichloroanisole | 28.85 | 213 | 215 | |
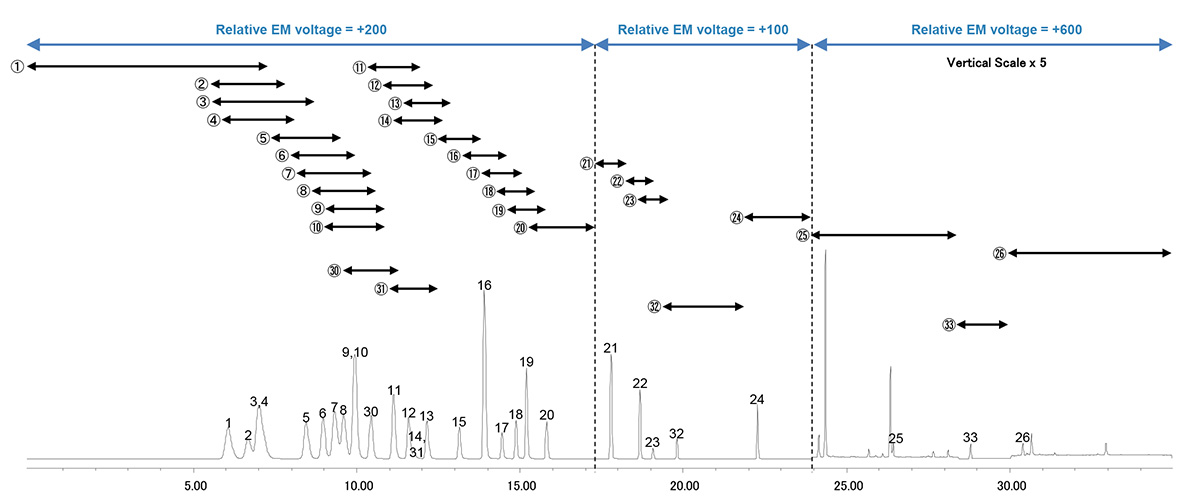
Figure 1. pd-SIM Acquisition range of each compound & Relative EM voltage condition for VOC, 2-MIB, Geosmine
(The numbers in the figure correspond to the numbers in Table 2.)
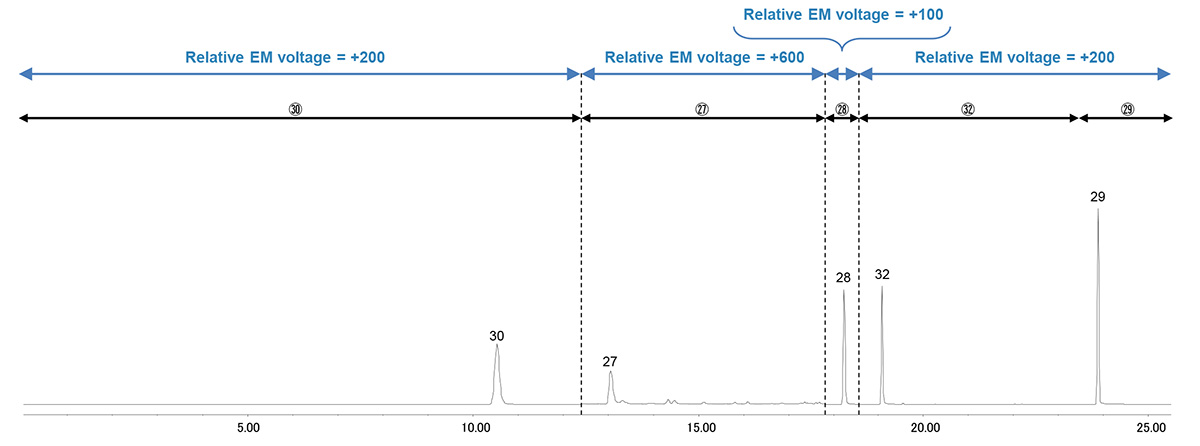
Figure 2. SIM Acquisition range of each compound & Relative EM voltage condition for Epichlorohydrin, Styrene, 1,2,3-Trichlorobenzene
(The numbers in the figure correspond to the numbers in Table 2.)
3.測定結果
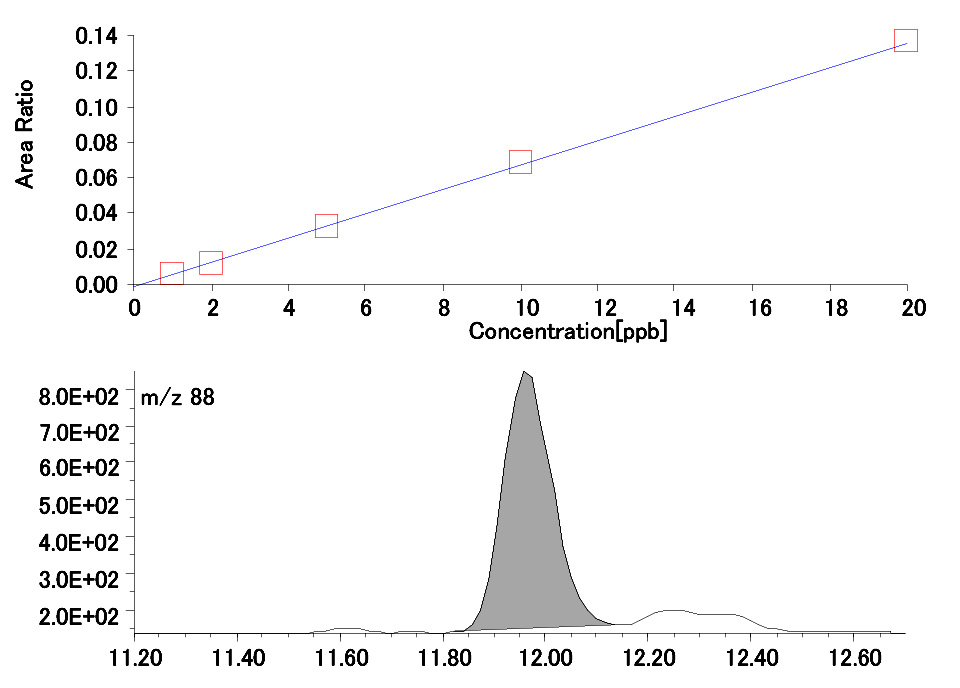
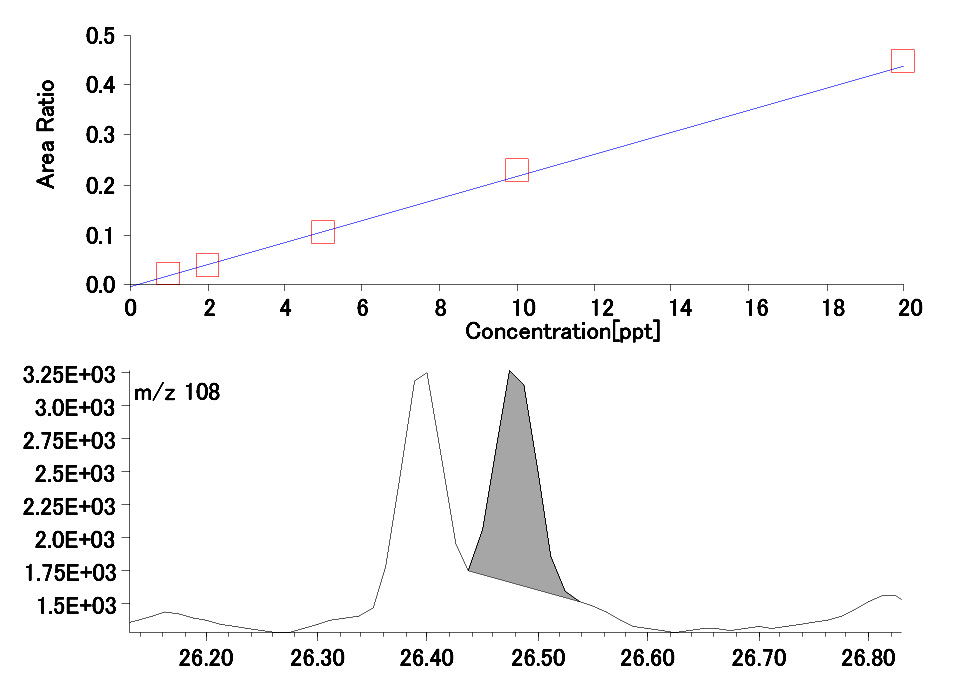
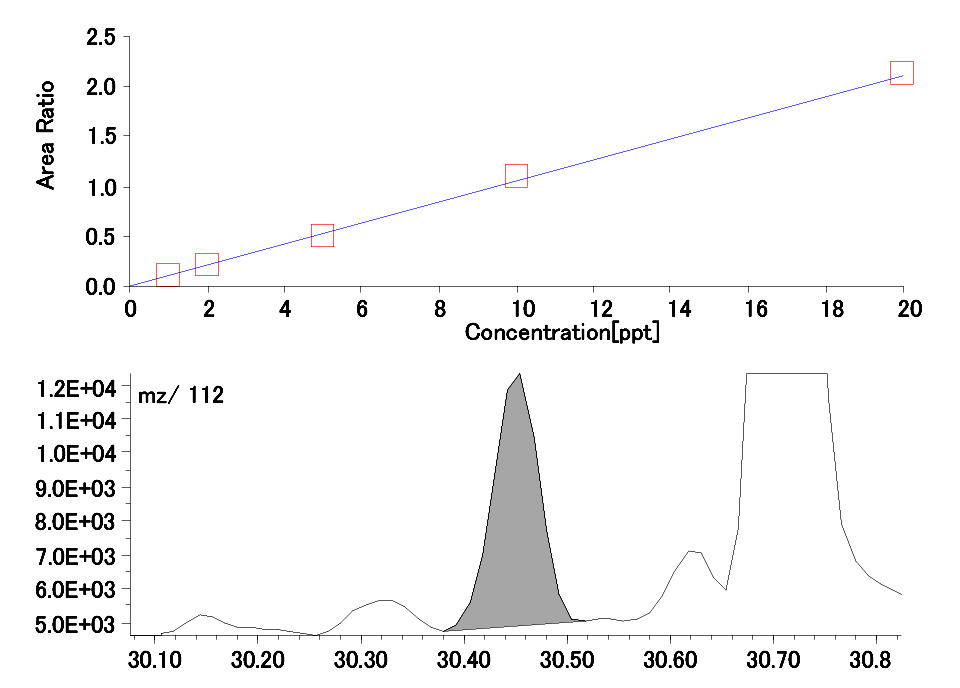
測定対象より、1,4-ジオキサン、2-MIB、ジェオスミン、エピクロロヒドリンについて、それぞれ検量線と検量線の下限濃度のSIMクロマトグラムをFigure3に示した。下限濃度は対象の成分の基準値あるいは目標値の1/10以下に相当するが、何れも十分な強度で測定が出来ており、検量線についても良好な直線性が得られている。
1,4-Dioxane
2-Methylisoborneol
Geosmin
Epichlorohydrin
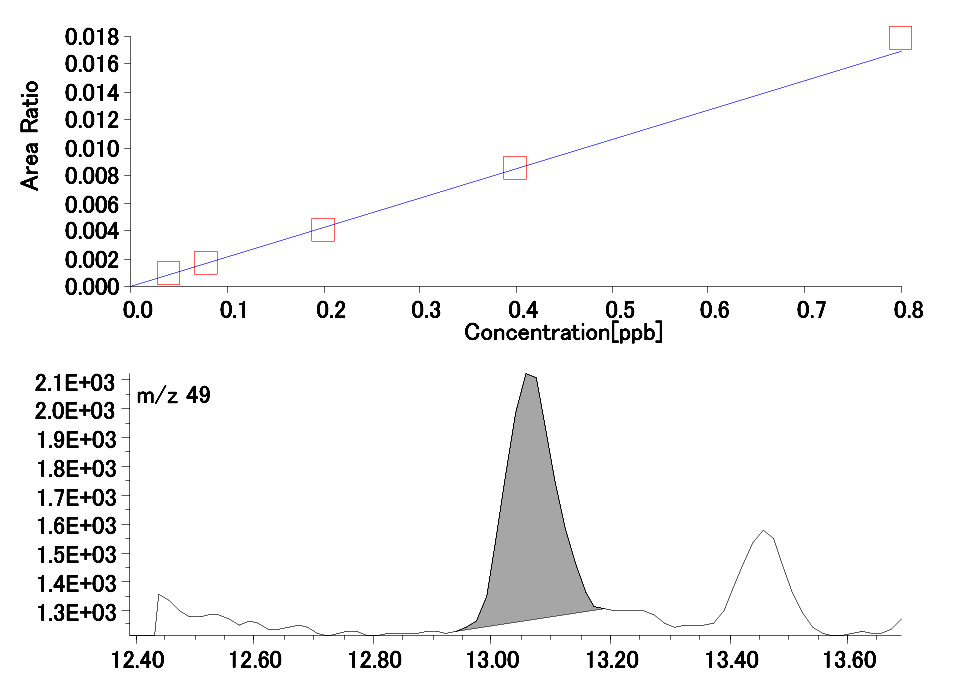
Figure 3. Calibration curve and SIM chromatogram of minimum plot of 1,4-Dioxane, 2-Methylisoborneol, Geosmin, Epichlorohydrin.
測定した全ての成分について、検量線の相関係数と検量線の下限濃度をn=5で連続測定した際の定量値の変動係数をTable 3に示した。相関係数は全ての成分で0.999以上、変動係数についても全ての成分で5%以下であり、良好な結果であった。
Table 3. Coefficient of variation (C.V.) and correlation coefficient of each compound.
| Compound Name | C.V.(%) | R |
|---|---|---|
| 1,1-Dichloroethylene | 0.7 | 0.9999 |
| Dichloromethane | 1.1 | 0.9999 |
| t-Butyl Methyl Ether | 0.4 | 0.9999 |
| trans-1,2-Dichloroethylene | 0.7 | 0.9999 |
| cis-1,2-Dichloroethylene | 0.6 | 0.9999 |
| Chloroform | 0.8 | 0.9999 |
| 1,1,1-Trichloroethane | 0.4 | 0.9999 |
| Carbon Tetrachloride | 1.6 | 0.9999 |
| 1,2-Dichloroethane | 0.8 | 0.9998 |
| Benzene | 1.2 | 0.9999 |
| Compound Name | C.V.(%) | R |
|---|---|---|
| Trichloroethylene | 0.1 | 0.9999 |
| 1,2-Dichloropropane | 0.8 | 0.9999 |
| Bromodichloromethane | 0.6 | 0.9999 |
| 1,4-Dioxane | 1.1 | 0.9999 |
| cis-1,3-Dichloropropene | 1.7 | 0.9990 |
| Toluene | 0.7 | 0.9999 |
| trans-1,3-Dichloropropene | 2.2 | 0.9985 |
| 1,1,2-Trichloroethane | 3.0 | 0.9990 |
| Tetrachloroethylene | 2.3 | 0.9996 |
| Dibromochloromethane | 0.8 | 0.9991 |
| Compound Name | C.V.(%) | R |
|---|---|---|
| m-Xylene & p-Xylene | 0.3 | 0.9992 |
| o-Xylene | 0.4 | 0.9999 |
| Bromoform | 0.6 | 0.9990 |
| p-Dichlorobenzene | 1.1 | 0.9999 |
| 2-Methylisoborneol | 4.5 | 0.9996 |
| Geosmin | 3.4 | 0.9996 |
| Epichlorohydrin | 2.6 | 0.9999 |
| Styrene | 1.5 | 0.9990 |
| 1,2,3-Trichlorobenzene | 9.0 | 0.9997 |
- このページの印刷用PDFはこちら。
クリックすると別ウィンドウが開きます。 
PDF 487.3KB