光電子相関顕微鏡法
光電子相関顕微鏡法
CLEM, Correlative Light and Electron Microscopy
[目次:試料等(試料および試料作製)]
光電子相関顕微鏡法(CLEM:Correlative Light and Electron Microscopy)は、蛍光標識したタンパク質に特定の波長の光を照射して蛍光させ、細胞内のタンパク質を含む構造物(リボソーム、ミトコンドリアなど)を光学顕微鏡(LM)で観察し、さらに同じ部位の一部を透過電子顕微鏡(TEM)で拡大して、その微細構造を観察する手法である。生物試料では、蛍光タンパク質や蛍光免疫染色法の開発により、特定のタンパク質を含む構造物を蛍光顕微鏡やコンフォーカルレーザー顕微鏡で観察できる。CLEMは主に生命科学分野で利用されている。
生物試料以外では、鉱物やソフトマテリアルの分野でLMの偏向顕微鏡とTEMを組み合わせて、結晶の組織の解析に用いられている。
CLEMの利点を纏めると、蛍光標識により細胞内の特定のタンパク質の位置を可視化でき、細胞を生きたまま観察できる点や広い視野を観察できるLMの利点と、ナノメートルレベルの高い空間分解能を持ち細胞内の微細構造を詳細に観察できるTEMの利点を活用していることである。
図1に細胞を観察する際のCLEMの手順の一例を示した。まず、(a)観察したい細胞を培養し、細胞内のタンパク質を蛍光染色する。次に、(b)蛍光染色した試料を光学顕微鏡で観察し、調べたいタンパク質を含む構造物の位置を特定する。その後、(c)細胞を化学固定し、ブロック染色を行ったうえで樹脂包埋し、細胞をかたまりで切り出す。さらに、(d)ウルトラミクロトームを用いて超薄切片を作製し、電子顕微鏡用の支持膜上に載せる。(e)必要に応じて光学顕微鏡観察し、最後に、(f)透過電子顕微鏡で細胞内の構造物の微細構造を観察する。
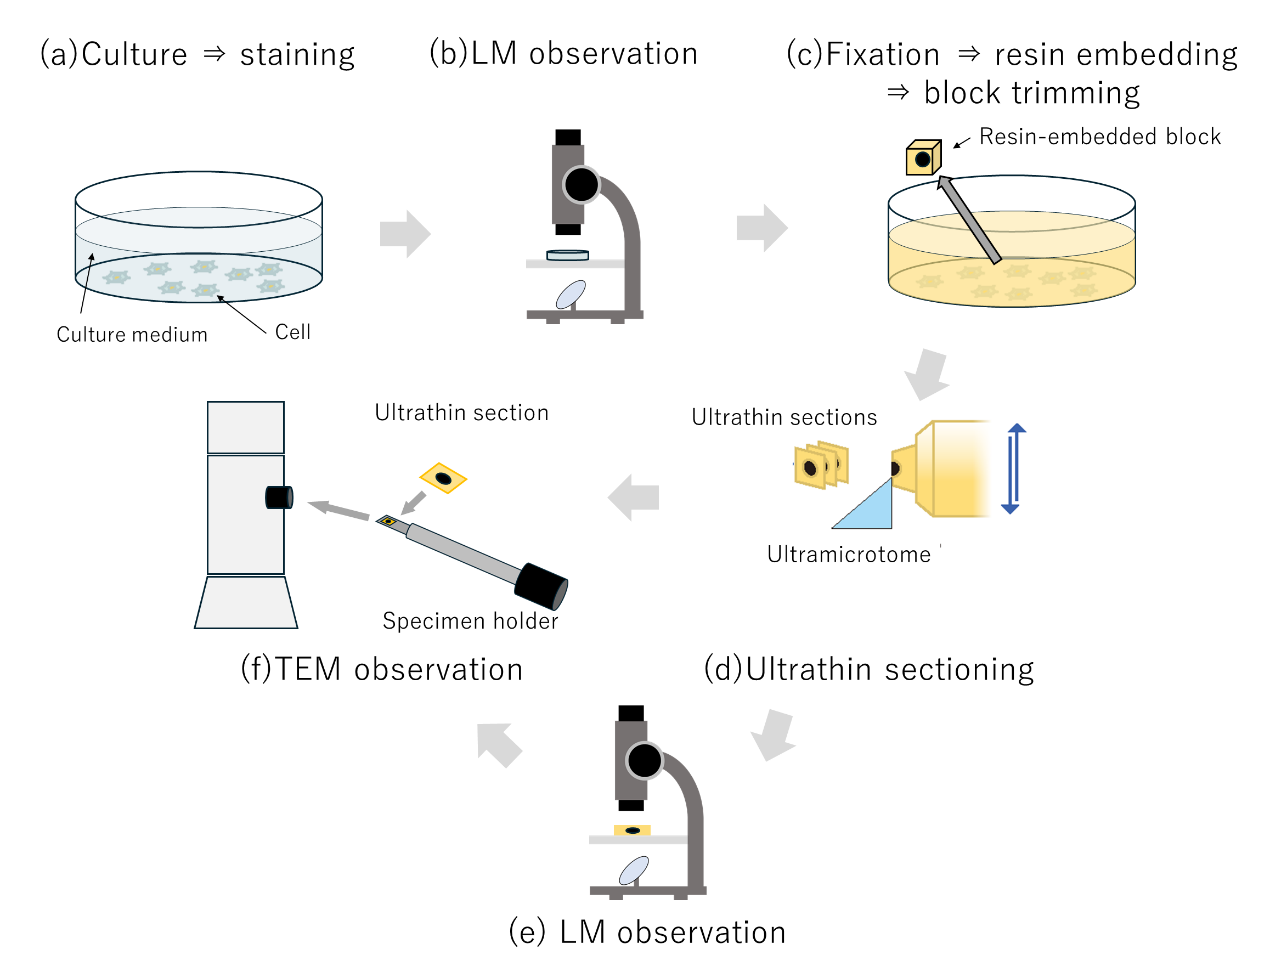
図1 CLEMの手順の一例
ここではHeLa細胞をCLEMで観察した例を示す。図2はHeLa細胞の細胞膜全体(細胞膜、細胞質、核)を視野内に含む倍率で取得したLM像(a)とTEM像(c)、それらの重ね合わせ像(b)およびTEM像の拡大像(d)である。LM像では蛍光染色により、核(青色), 細胞質の領域にTubulin(オレンジ色), 細胞を取り囲むようにActin(緑色)が分布しているのがわかる(a)。重ね合わせ像(b)から、LM像(a)とTEM像(c)で同じHeLa細胞が観察されていることがわかる。(c)は900枚(縦横30枚×30枚)の画像をつなぎ合わせたTEM像である。TEMの拡大像(d)では、LMの分解能では観察できない、HeLa細胞のフィラメントの構造(繊維状の構造)が観察されている。
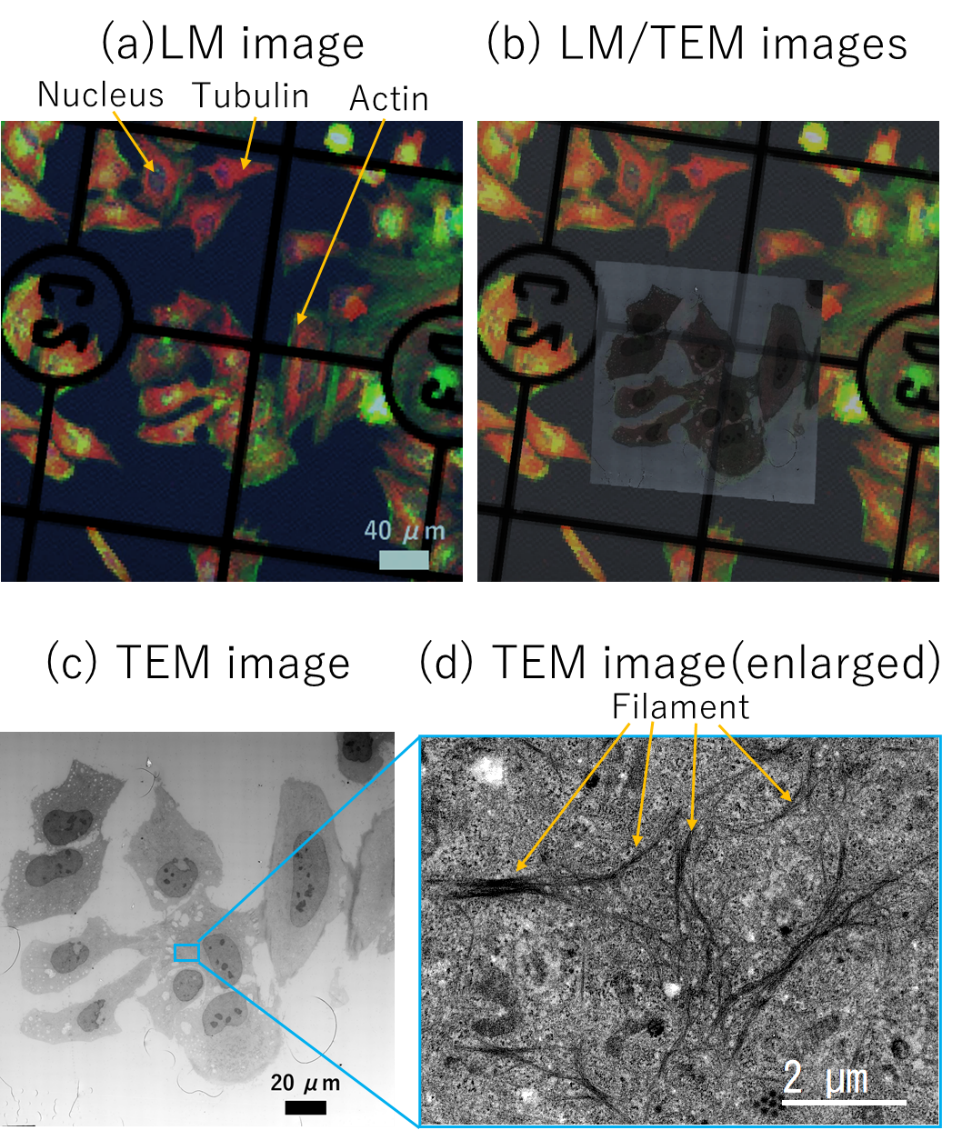
図2 HeLa細胞の(a)LM像、(b) LM像とTEM像を重ね合わせた像、
(c) 広域モンタージュシステムを使用して合成したTEM像、
(d) TEM像(c)の青線部分の拡大像(デジタルズーム)
“Correlative Light and Electron Microscopy (CLEM)” is a technique in which fluorescently labeled proteins are excited with light of specific wavelengths to induce fluorescence, allowing intracellular structures (e.g. ribosomes and mitochondria) containing those proteins to be observed with a light microscope (LM). The same regions are then further magnified with a transmission electron microscope (TEM) to visualize their fine structures in detail.
In biological specimens, the development of fluorescent proteins and fluorescence immunolabeling techniques has made it possible to observe the intracellular structures containing specific proteins using a fluorescence microscope or a confocal laser microscope. CLEM is therefore widely used in the life sciences. For non-biological fields, CLEM is applied in mineralogy and soft materials research, where a polarized light microscope is combined with TEM to analyze crystal textures and microstructures.
CLEM is characterized by a combined use of the complementary strengths of LM and TEM. That is, LM allows us to visualize the intracellular localization of specific proteins through fluorescent labeling and to observe live cells and a wide field of view, and TEM provides nanometer scale spatial resolution for detailed examination of the intracellular structures.
Fig. 1 illustrates an example of the CLEM workflow used for observing cells.
First, (a) the cells of interest are cultured, and the intracellular proteins are fluorescently labeled. Next, (b) the fluorescently labeled specimen is observed under an LM to identify the locations of the intercellular structures containing the target proteins. Then, (c) the cells are chemically fixed, en bloc stained, embedded in a resin, and excised as a solid block containing the target cells. Subsequently, (d) ultrathin sections are prepared using an ultramicrotome and mounted onto a supporting film for TEM. If necessary, (e) the sections are examined again with an LM. Finally, (f) the fine intracellular structures are observed using TEM.
Fig. 1 Example of CLEM workflow.
Here, we present an example of observing HeLa cells using CLEM. Fig. 2 shows an LM image (a) and a TEM image (c) acquired at a magnification that includes the entire cell (cell membrane, cytoplasm, and nucleus) within the field of view, together with their overlaid image (b) and a higher magnification TEM image (d). In the LM image, fluorescent staining reveals the nucleus (blue), tubulin distributed throughout the cytoplasmic region (orange), and actin surrounding the cell (green) (a). The overlaid image (b) confirms that the same HeLa cell is observed in both the LM image (a) and the TEM image (c). Image (c) is a TEM image reconstructed from 900 individual frames (30 × 30 tiles). In the higher magnification TEM image (d), filamentous structures of the HeLa cell—features that cannot be resolved by LM—are clearly visualized.
Fig. 2 HeLa cell images. (a) LM image, (b) Overlay of LM and TEM images,
(c) TEM image synthesized using a wide‑area mosaic system,
and (d) Digitally zoomed TEM image of the region indicated by the blue line in (c).
関連用語から探す
説明に「光電子相関顕微鏡法」が含まれている用語


