位相コントラスト伝達関数
位相コントラスト伝達関数
phase-contrast transfer function, PCTF
[目次:理論(電子の散乱/回折/結像)]
電子が試料を透過すると、試料の静電ポテンシャル (屈折率) によって電子波の位相が変わる。TEM像は、散乱された電子波の振幅の二乗 (強度) の分布を見ているのであり、電子波の位相の変化をTEM像で観察 (検出) することはできない。そこで、位相の変化を振幅に変換することによって位相の分布をTEM像で観察することが可能になる。回折波の位相を変換して得た振幅が、どの程度TEM像に寄与する (伝達される) かを表した関数を位相コントラスト伝達関数 (PCTF) という。なお、PCTFを用いて試料の像を議論できるのは、試料中で多重散乱がなく、電子線が受ける位相の変化が小さい (弱位相物体近似という) 場合で、具体的には試料の厚さが~10 nm以下の場合である。
電子線の位相だけを少しだけ変えるような薄い試料 (弱位相物体) の場合には、対物レンズの持つ球面収差に応じて対物レンズの焦点はずし量を調整することで、回折波の位相が振幅に変換され、試料の像が得られる。PCTFは、球面収差係数CSと焦点はずし量dfをパラメータとして、空間周波数qの関数として表される [1] 。

ここで、λは電子線の波長を表す。括弧の中の第1項は焦点はずしによる回折波の位相変化で空間周波数qの2乗に比例する。第2項は球面収差による回折波の位相変化を表し空間周波数qの4乗に比例する。これらを足し合わせた位相変化のサイン関数がPCTFであり、回折波の位相の振幅への寄与の度合いを表している。位相変化がπ/2もしくは–π/2に近づくと、PCTFの値が1もくしは–1に近くなり、試料による位相変化は効果的に振幅に変換され、より正しい試料の像が得られる。全ての空間周波数に亘って関数の値が+1もしくは–1であれば理想的な像が得られる。しかし、球面収差の項と焦点はずしの項はqの次数が異なるため、そのような理想的な条件を作ることができない。そこで、なるべく広い空間周波数に亘って位相変化を–π/2に近づける条件 (シェルツァー・フォーカス条件) を選択すると、PCTFの値が広い空間周波数に亘って –1に近くなり、位相物体をTEM像として、すなわち試料を透過した電子波の強度 (振幅の2乗) として、観察できる。
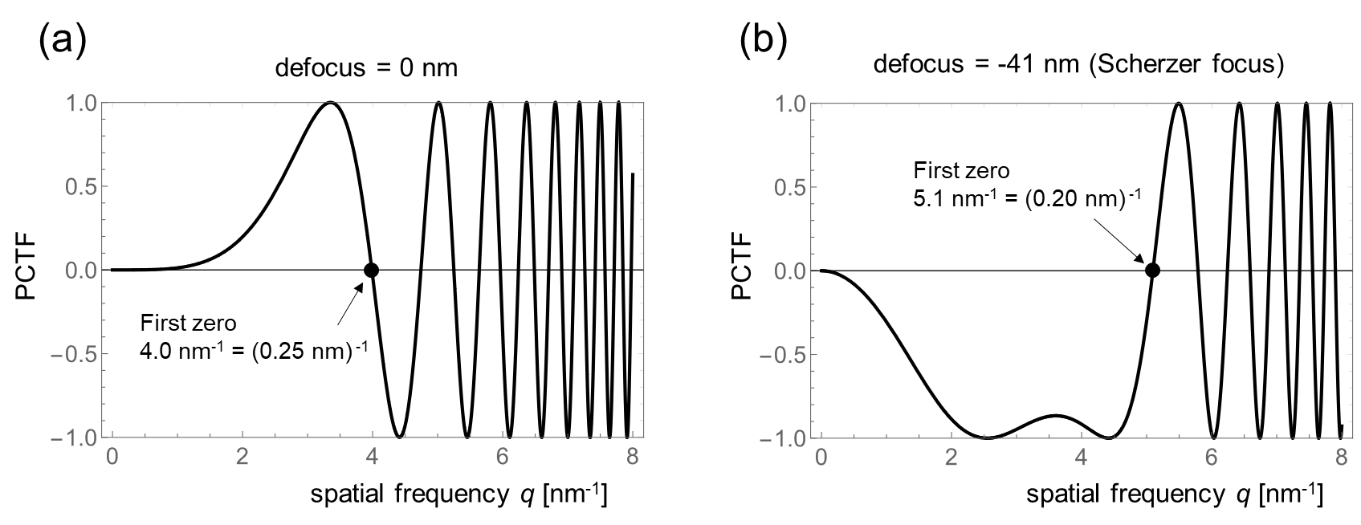
図に位相コントラスト伝達関数のグラフの例を示す。横軸は空間周波数であり、縦軸はPCTFの値を表す。図 (a) は正焦点の場合である。PCTFの値が+1に近づいている周波数領域が狭いので正しい像は得られない。 (値が正の場合は、原子の位置が相対的に明るく結像される。) 図 (b) はシェルツァー・フォーカス条件の場合を示す。PCTFの値が、幅広い周波数領域で –1に近づいている。 (値が負の場合は、原子の位置が相対的に暗く結像される。) PCTFが最初に横軸を切る周波数 (ファーストゼロ) の逆数を像の分解能と定義している。ファーストゼロより高い周波数では関数が正負にまたがって大きく変動するので、計算などの後処理をしない限り、それらの寄与は打ち消し合い、像の形成にはほぼ寄与しない。
より精確には色収差などの効果によって周波数の増加とともに干渉性が悪くなる効果を表すエンベロープ (包絡) 関数をPCTFに掛け算する必要がある。

図: 位相コントラスト伝達関数の例。加速電圧200 kV、球面収差係数0.5 mm。
(a) 正焦点 (df = 0 nm) の場合と (b) シェルツァー・フォーカス (df = –41 nm) に合わせた場合。
シェルツァー・フォーカスの場合は、正焦点の場合に比べて、像に寄与する回折波の位相 (振幅) の周波数領域が広く、ファーストゼロの空間周波数も高い。ファーストゼロの周波数は5.1 nm-1であり、空間分解能は0.20 nmになる。
参考文献
[1] David B. Williams and C. Barry Carter, "Transmission Electron Microscopy: A Textbook for Materials Science", Springer.
When an electron passes through a specimen, the electron wave undergoes a phase change due to the electrostatic potential (refractive index) of the specimen. The TEM image represents the positional change of the square of amplitudes (intensities) of the electron wave passing through the specimen, but the phase change of the electron wave cannot be observed (detected) in the TEM image. Thus, by converting the phase change into an amplitude change, the phase change can be observed in the TEM image.
The phase-contrast transfer function (PCTF) is a function to express what extent the amplitudes converted from the phase changes of the diffracted waves contribute (are transferred) to the TEM image. It should be noted that the PCTF is valid only for the image formation of a thin specimen in which the phase shifts of the diffracted waves are small (weak phase object approximation) and no multiple scattering occurs, i.e. for specimens with a thickness less than ~10 nm.
For a thin specimen (weak phase object) which slightly changes only the phase of the electron wave, if the phases of the diffracted waves are converted into the amplitudes by adjusting the defocus amount of the objective lens depending on the spherical aberration of the objective lens, the image of the thin specimen is produced.
The PCTF is expressed as a function of the spatial frequency q with the spherical aberration coefficient CS and the defocus amount df as parameters in the following equation [1].

Here, λ is the electron wavelength. The first term in the parentheses represents the phase changes of the diffracted waves due to defocus and is proportional to the square of the spatial frequency q. The second term is the phase changes of the diffracted waves due to spherical aberration and is proportional to the fourth power of the spatial frequency q. The sine function of the whole phase changes due to these terms is PCTF. PCTF represents the contribution of the phases of the diffracted waves to the amplitudes.
If the phase change approaches π/2 or -π/2, the value of PCTF approaches 1 or -1. Then, the phase change due to the specimen is effectively converted into an amplitude and a more correct specimen image is formed. An ideal image is obtained if PCTF is +1 or -1 over all spatial frequencies. However, since the spherical aberration term and the defocus term have different orders of q, such an ideal condition cannot be created. Thus, if an appropriate condition (Scherzer focus condition) is selected, where the phase change is as close to -π/2 as possible over a wide range of spatial frequencies as possible, the value of PCTF becomes close to -1 over the range. As a result, the phase object can be observed as a TEM image i.e. as the intensity (square of amplitude) of the transmitted wave through the specimen.
Figures show two examples of PCTF. The horizontal axis stands for spatial frequency and the vertical axis for the value of PCTF. Fig. (a) shows PCTF for the in-focus condition. Since the frequency range with the value of PCTF close to +1 is narrow, the correct image cannot be obtained. (When the value of PCTF is positive, the atomic sites are imaged bright.) Fig. (b) shows PCTF for the Scherzer focus condition. The value of PCTF is close to -1 over a wide frequency range. (When the value of PCTF is negative, the atomic sites are imaged dark.) The reciprocal of the frequency at which PCTF firstly crosses the horizontal axis (first zero) is defined as the resolution of the crystal structure image. At the frequencies higher than the first zero, the value of PCTF oscillates severely over the positive and negative values. Then, their contributions cancel out each other, that is, there is almost no contribution to the image formation unless post-data processing is performed.
To be more precise, the PCTF should be multiplied by an envelope function, which represents the effect of chromatic aberration and other effects which make the interference effect worse with increasing spatial frequency.

Fig. Examples of PCTF for an accelerating voltage of 200 kV and the coefficient CS = 0.5 mm.
(a) In-focus (df = 0 nm), (b) Scherzer focus (df = -41 nm).
In the case of the Scherzer focus, the frequency range of the phases (amplitudes) of the diffracted waves contributing to the image is wider and the spatial frequency of the first zero is higher than in the case of the in-focus. The frequency of the first zero is 5.1 nm-1, giving a spatial resolution of 0.20 nm.
Reference
[1] David B. Williams and C. Barry Carter, "Transmission Electron Microscopy: A Textbook for Materials Science", Springer.
関連用語から探す
説明に「位相コントラスト伝達関数」が含まれている用語


