(L2, L3), (M4, M5)…スペクトル
(L2, L3), (M4, M5)…スペクトル
(L2, L3), (M4, M5)…spectra
[目次:分光分析(EELS/EDS/電子構造)]
EELSスペクトルにおいて、元素のL2とL3準位あるいはM4とM5準位から伝導帯への電子励起に伴うスペクトル。L2とL3準位のエネルギー差だけ異なる似た形状のスペクトルが二つ現れる。 これを (L2, L3)スペクトルと呼ぶ。例えば、3d遷移金属元素のL2とL3準位のエネルギー差は5~20eV程度である。M4とM5スペクトルも同様の性質を持つ。
内殻電子準位2pおよび3dは、スピン軌道相互作用により、それぞれL2(2p1/2)と L3(2p3/2)およびM4(3d3/2)とM5(3d5/2)に分かれている。 L2およびL3スペクトルは、それぞれ内殻電子準位L2(2p1/2) および L3(2p3/2)から伝導電子帯の3d成分への遷移スペクトルである( )。 M4およびM5スペクトルは、それぞれ内殻電子準位M4(3d3/2)およびM5(3d5/2)から伝導電子帯の4f成分への遷移スペクトルである。 L2スペクトルとL3スペクトルは、終状態である3d非占有状態は同じなので、内殻準位L2とL3のエネルギー差だけ離れて似た形状のスペクトルとして現れる。
L2スペクトルとL3スペクトルの強度比は、内殻軌道のL2, L3準位での電子の占有数からは1:2になると期待される。 しかし、実際にはコア・ホール相互作用、終状態でのスピン軌道相互作用や3d電子のクーロン反発によって、3d電子の伝導電子帯の状態密度や遷移の選択測が変わるために強度比が1:2からずれる。 逆に、強度比が1:2からずれる現象を使って、3d遷移金属の価数の知見を得ることができる。
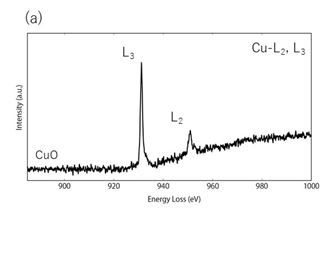
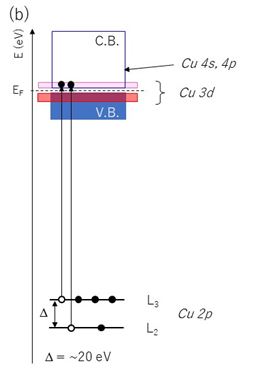
酸化銅(CuO)のL2,L3吸収端スペクトルを図1(a)に示す。20eV隔ててL2とL3の2つのピークがみられる。L2とL3遷移の強度比は1:2からずれている。 図1(b)にCuOの電子エネルギー状態の模式図を示す。L2, L3準位はスピン軌道相互作用により、約20eVのエネルギーの隔たりがある。伝導電子帯の底にエネルギー的に狭いCu-3d成分の非占有状態が存在する。 観測されたスペクトルは、L2, L3内殻準位からその3d非占有状態への遷移スペクトルである。CuOのCu2+の電子配置は、[3d9, 4s0]であり3d5/2に1つ空孔がある。 この場合の遷移選択則は、スピン軌道相互作用によって、軌道角運動量ではなく全角運動量 である。よって、2p3/2(L3)から3d5/2への遷移は許容されるが、 2p1/2(L2)から3d5/2への遷移は禁制である。そのため、L3ピークは観測されるが、L2ピークは観測されないはずである。しかし、実際には弱いL2ピークが観測されている。 その理由は、Cu-O間でわずかに共有結合をして3d3/2軌道成分に空孔ができているからである。
図1:
(a)酸化銅(CuO)のCu-L2, L3吸収端スペクトル。932eVのピークがL3遷移スペクトル、952 eVのピークがL2遷移スペクトル。L2スペクトルとL3スペクトルの強度比は1:2からずれているのがわかる。 ⇒図1(a)
(b)CuOのエネルギー状態とL2, L3遷移過程の模式図。V.B.は価電子帯、C.B.は伝導電子帯を表す。図中の赤とピンクの領域は、それぞれCu-3d軌道の占有状態と非占有状態を表す。 伝導電子帯のCu-4s軌道成分はエネルギー的に広がっており、その状態密度は小さい。そのために4s軌道への遷移スペクトル強度はブロードなバックグラウンドとして観測されている。⇒図1(b)
第6周期元素のM4とM5準位のエネルギー差は10 ~ 120eVなので、EELSスペクトルには、それらのエネルギー差だけ異なる似た形状のスペクトルが連続して現れる。M4スペクトルとM5スペクトルの強度比は、内殻軌道の3d電子準位での電子の占有数から2:3になると期待される。
チタン酸バリウム(BaTiO3)のBa-M4, M5吸収端スペクトルを図2(a)に示す。約15eV隔ててM4とM5の2つのピークがみられる。M4とM5遷移の強度比はほぼ2:3になっている。図2(b)にBaTiO3のエネルギー状態の模式図を示す。BaのM4, M5準位はスピン軌道相互作用により、約15eVのエネルギーの隔たりがある。伝導電子帯中に、エネルギー的に狭いBa-4f成分の非占有状態が存在する。M4, M5内殻準位から4f非占有状態への遷移スペクトルが観測される。
バリウム原子のL2, L3吸収端は5247eVおよび5624eVと報告されている。通常、EELS測定は1000eV程度までなので、BaのL2, L3吸収端の観測は困難である。
図2:
(a)チタン酸バリウム(BaTiO3)のBa-M4, M5吸収端スペクトル。780 eVのピークがM5遷移スペクトル、795 eVのピークがM4遷移スペクトル。M4スペクトルとM5スペクトルの強度比は占有比から期待される比とほぼ同じ2:3になっている。 ⇒図2 (a)
(b)BaTiO3のエネルギー状態とM4, M5遷移過程の模式図。ピンクの領域はBa-4f軌道成分を表す。Ba-4f軌道の14個の席はすべて非占有状態なので、M4とM5のピーク強度は非常に強く観測される。Ba-6sとBa-6p軌道成分はエネルギー的に広がっており、その状態密度は小さい。6s軌道への遷移は禁制である。6p軌道への遷移スペクトル強度はブロードなバックグラウンドになる。しかし、その強度はM4とM5のピーク強度に比べて非常に弱い。 ⇒図2(b)
スピン軌道相互作用は、原子核の正電荷+Zeと内殻電子の軌道半径の-3乗に比例する。そのため、原子番号が大きくなるにつれ、L2, L3準位間およびM4, M5準位間のエネルギー差は大きくなる。また、同一原子の場合、M殻の軌道半径はL殻よりも大きいので、M4, M5準位間のエネルギー差はL2, L3準位間の差よりも小さくなる。
AlやSiなどの第3周期元素では、L2, L3スペクトルは内殻2p準位から伝導帯3s成分への遷移として観察される。原子番号が小さいのでL2とL3準位の差が1eV以下になり、L2, L3スペクトルは分離しない一つの吸収端スペクトルとして観測される。このような場合、L2,3と書かれることが多い。
(東北大学多元物質科学研究所 准教授 佐藤庸平 執筆)
EELS spectra associated with electronic excitation from the L2 and L3 levels of elements or the M4 and M5 levels to the conduction band. Two similar-shaped spectra appear with an energy difference between the L2 and L3 levels. The spectra set is called (L2 and L3) spectra. For example, the energy difference between the L2 and L3 levels of the 3d transition metals is about 5 to 20 eV. The M4 and M5 spectra show a similar feature to (L2 and L3) spectra.
Due to the spin-orbit coupling, the 2p and 3d inner-shell levels split into two levels. That is, the 2p split levels are expressed as L2(2p1/2) and L3(2p3/2), and the 3d split levels are expressed as M4(3d3/2) and M5(3d5/2) (). L2 and L3 spectra are caused by the transition respectively from the levels L2(2p1/2) and L3(2p3/2) to the 3s and 3d components of the conduction band. M4 and M5 spectra are caused by the transition respectively from the levels M4(3d3/2) and M5(3d5/2) to p and f components of the conduction band. Since the final states of the unoccupied states are the same for both transitions, L2 and L3 (M4 and M5) spectra appear as spectra of similar shape separated by the energy difference between the levels L2 and L3 (M4 and M5).
The intensity ratio of the L2 and L3 spectra is expected to be 1:2 from the occupation ratio of the inner-shell L2 and L3 levels. However, the ratio experimentally observed is different from the expected ratio because the density of states of 3d electron in the conduction band is modified and the selection rule for electron transitions becomes different due to the core-hole interaction, the spin orbit coupling at the final state and the Coulomb repulsion of 3d electrons. Utilizing the phenomenon in which the intensity ratio deviates from 1:2, information on the valence of the 3d transition metal can be obtained.
Fig. 1(a) shows L2 and L3 (absorption edge) spectra of copper oxide (CuO). Two peaks of L2 and L3 spectra are separated by about 20 eV. The intensity ratio of L2 and L3 deviates from 1:2. Fig. 1(b) illustrates the electronic energy state of CuO. The L2 and L3 levels have an energy difference of approximately 20 eV due to spin orbit coupling. The observed spectra are interpreted as those from the inner-shell L2 and L3 levels to 3d unoccupied narrow states which is formed at the bottom of the conduction band. The electron configuration of Cu2+ in CuO is [3d9, 4s0] and one hole exists at 3d5/2. The transition selection rule in this case is not determined by the orbital angular momentum change but by the total angular momentum change due to the spin-orbit coupling. Thus, the transition from 2p3/2(L3) to 3d5/2 is allowed, but the transition from 2p1/2(L2) to 3d5/2 is forbidden. This indicates that the L3 peak should be observed, but the L2 peak should not be observed. However, a weak L2 peak is observed in the experiment as shown in Fig. 1(a). This is because there exist holes at the 3d3/2 orbital component, which are caused by a weak covalent bonding between Cu and O.
The difference of the M4 and M5 energy levels of sixth-period elements is 10 to 120 eV. Two spectra with similar shape successively appear with the energy difference in the EELS spectrum. The intensity ratio of the M4 and M5 spectra is expected to be 2:3 from the occupation ratio of the inner-shell 3d electron levels.
Fig. 2(a) shows M4 and M5 (absorption edge) spectra of Ba in barium titanate (BaTiO3). Two peaks of M4 and M5 levels are seen with an energy difference of approximately 15 eV. The intensity ratio of M4 and M5 is approximately 2:3 as expected. Fig. 2(b) illustrates the electronic energy state of BaTiO3. The M4 and M5 levels for Ba have the energy difference of approximately 15 eV due to spin-orbit coupling. The unoccupied narrow state of Ba-4f component is formed in the conduction band. Thus, transition spectra from the inner-shell M4 and M5 levels to the 4f unoccupied state are observed.
The L2 and L3 absorption edges of barium are reported to be 5247 eV and 5624 eV. Usually, as EELS measurements are performed up to about 1000 eV, it is difficult to observe the L2 and L3 spectra of barium.
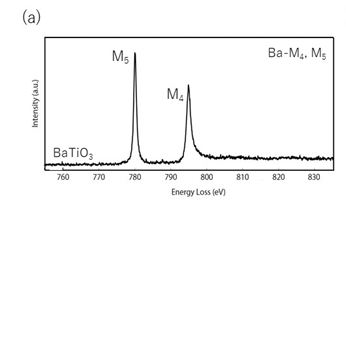
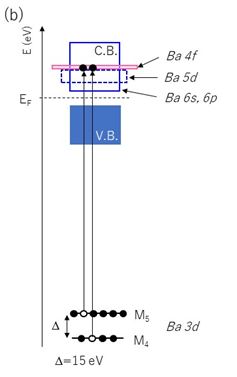
Fig. 2 (a) M4 and M5 (absorption edge) spectra of Ba in barium titanate (BaTiO3). The M5 transition peak appears at 780 eV, and the M4 peak at 795 eV. The intensity ratio of the M4 and M5 spectra is approximately 2:3, indicating that the experimentally obtained ratio is close to the expected ratio. (b) Schematic of the electronic energy state of BaTiO3 and the process of M4 and M5 transitions. The pink part shows Ba-4f orbital component. Since 14 seats of Ba-4f orbitals are unoccupied, the M4 and M5 peaks are observed extremely strong. The Ba-6s and Ba-6p orbitals form a relatively broad conduction band and the density of states is small. The transition to the 6s orbital is forbidden. The transition spectra to the 6p orbitals form broad background. The background is very weak comparing with the M4 and M5 peaks.
For the third periodic elements (Al, Si, etc.), L2 and L3 spectra are created by the transitions from the inner-shell 2p levels to 3s components in the conduction band. Since the energy difference between the L2 and L3 levels is less than 1 eV, L2 and L3 spectra are observed as one absorption edge spectrum without splitting. Then, L2 and L3 spectra in such a case are written as L2,3.
(By Associate Professor Yohei Sato, Tohoku University)
関連用語から探す
説明に「(L2, L3), (M4, M5)…スペクトル」が含まれている用語


