クラーマス・クローニッヒ解析
クラーマス・クローニッヒ解析
Kramers-Kronig analysis
[目次:分光分析(EELS/EDS/電子構造)]
電子エネルギー損失分光 (EELS) スペクトルから誘電関数ε(ω) の逆数である1/ ε(ω) の虚部が求まる。得られた虚部にクラーマス・クローニッヒの関係式を適用すると、1/ ε(ω)の実部が求まる。求まった1/ ε(ω)の実部と虚部から代数計算によって、複素誘電関数 ε(ω) = ε1(ω) + iε2(ω) が導出される。1/ ε(ω)の虚部からε(ω) = ε1(ω) + iε2(ω) を導出する手法をクラーマス・クローニッヒ解析 (KK解析) と呼ぶ。複素誘電関数は、材料の光学的性質(屈折率、反射率、光吸収)を与えるので、KK解析はEELSスペクトルから材料の光学的性質を求めるために不可欠な方法である。
EELSにおけるクラーマス・クローニッヒ解析の手順
ダイヤモンドのEELSスペクトル (図1 (a) 黒線) からKK解析により複素誘電関数ε(ω) を得る手順を以下に示す。
- 1 ) 価電子全体の集団振動であるプラズモンによる多重散乱強度を、フーリエ・ログ・デコンボリューション法を用いて除去する (図 (a)、矢印①)。
- 2 ) 0-2 eV付近のゼロロスピークの裾野強度を除去する (図1 (a) 矢印②)。裾野強度を除去する方法には、試料を挿入していないゼロロスピークの裾野強度を用いて除去する方法や、適当な関数を仮定してフィッティングして除去する方法がある。
- 3 ) 分光器の取り込み角の制限で取得できなかったスペクトル強度を補正する。電子の非弾性散乱はほとんど前方散乱であるが、分光器による取り込み角を超える散乱も多少あるためである。以上の3つの処理を行ったスペクトルを、1回散乱スペクトル (SSD) と呼ぶ。
- 4 ) SSD強度ISSD(ω) の規格化を行って損失関数を導出する (図1 (b)実線)。ISSD(ω) を規格化し損失関数Im[-1/ ε(ω)]を求めるには、スペクトルの強度が固体中の電子の数に比例することを利用して、Sum-rule法 (付録1) を用いる。
- 5 ) クラーマス・クローニッヒの関係式 (1) (後述) を用いて、Im[-1/ ε(ω)]からRe[1/(ω)]を導出する (図1 (b) 点線)。
- 6 ) 最後に、代数式 (2), (3) (後述) を用いて誘電関数ε(ω) を導出する (図1 (c))。
クラーマス・クローニッヒの関係式
クラーマス・クローニッヒの関係式 (線形応答において周波数応答関数の実部と虚部の間に成り立つ関係式) は、分光測定で得た複素誘電関数の虚部から実部を求めるために用いられる[1, 2]。この関係式を用いて、EELSスペクトルから求めた損失関数Im[-1/ ε(ω) ]から、Re[1/ ε(ω)]が次式を用いて導かれる。
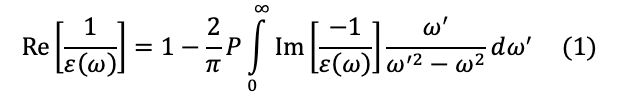
ここでReとImは、それぞれ複素関数の実部および虚部を表す。ωは角振動数を表す。Pはコーシーの積分主値と呼ばれ、ω = ω'の極以外での積分を表す。(1) 式の角振動数の積分範囲は0~無限大までだが、実験で得られるスペクトルのエネルギー範囲は100 eV以下である。そこで、(1) 式の計算を行うために、400 - 500 eV程度までのスペクトルを外挿して求める。
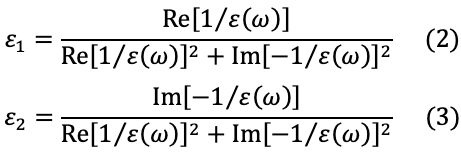
(1) 式を用いてRe[1/ ε(ω)]とIm[-1/ ε(ω)]が分かれば、 誘電関数の実部ε1(ω) と虚部ε2(ω) は以下の式を用いて代数的に求められる。
誘電関数から何がわかるか
導出した誘電関数 (図1 (c))から次のことがわかる。
- 1 ) ħω=0 eVでの誘電関数の実部ε1(0) はダイヤモンドの誘電率で、EELSから導出された値 ε=5.7は光学測定の結果と良く一致している。
- 2 ) ħω=34 eVの位置でプラズモンの励起条件ε1(ω) ~ 0(赤線)かつε2(ω)<<1 (青線)が満たされており、EELSスペクトルのプラズモンのピークに対応している。
- 3 ) ε1(ω) は12 eVで強い共鳴型の分散を示しており、バンド間遷移に対応している。そのとき、遷移によるエネルギーの吸収のために、誘電関数の虚部ε2(ω) にピークを生じている (青線のピーク)。このバンド間遷移は、sp3電子軌道のσ結合軌道 (σ) からσ反結合軌道 (σ*) への遷移である。さらにsp3電子軌道を構成する成分のうち、2p結合軌道から2s反結合軌道への弱い吸収が7 eVに見られ、ε1(ω) の弱い分散とε2(ω) の吸収の構造が観測できる (縦点線)。
- 4 ) 5.5 eVの位置に (逆三角印▼) ε2(ω) の強度立ち上がりが見られる。これは間接型のバンドギャップ間の遷移に対応する。間接型バンドギャップ間の遷移は、フォノンの励起を必要とするために、直接型の遷移よりも吸収が小さく観測されている。
エネルギーの吸収として誘電関数の虚部ε2(ω) に表れる7 eVの肩および12 eVのピークは、EELSスペクトルには明瞭には観測されず、KK解析によって誘電関数の虚部ε2(ω) として表したときに初めて明らかになる。他方、光学測定によるε2(ω) のスペクトルにはプラズモンのピークは表れず、EELSではプラズモンの直接観察ができるのが利点である。さらに、バンドギャップエネルギーは、KK解析をしなくても、EELSの強度の立ち上がり位置 (図1 (a) 逆三角印▼) から直接測定することができ、ε2(ω) の強度の立ち上がり位置 (図1 (c) 逆三角印▼) とも一致する。
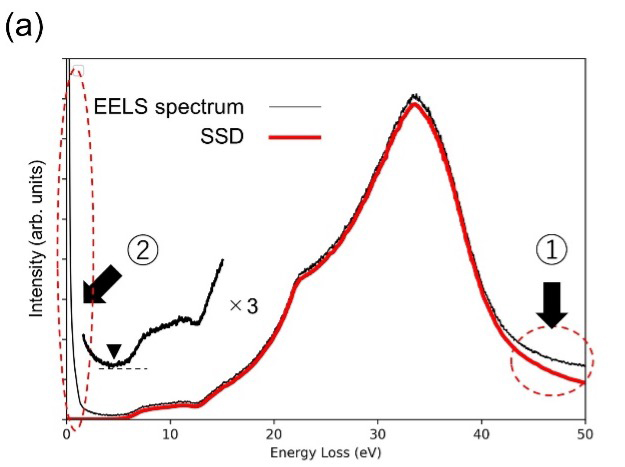
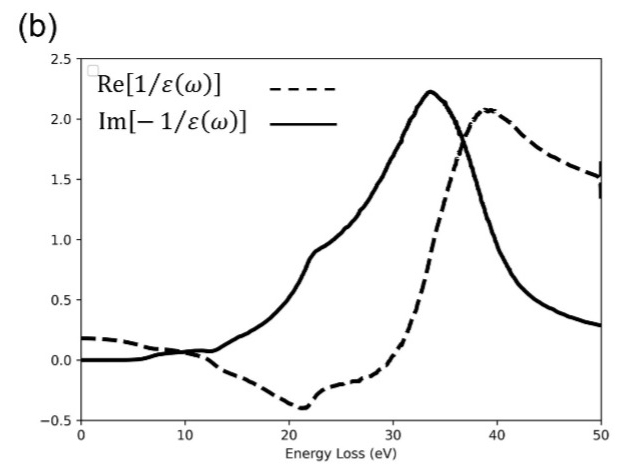
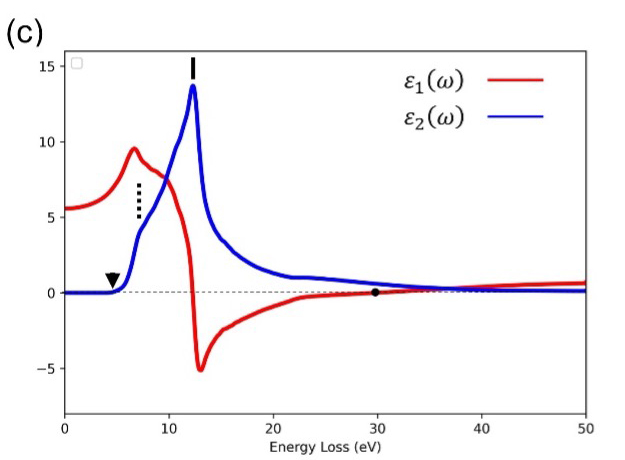
図1. (a) 実験で観測したダイヤモンドのEELSスペクトル (黒線) と一回散乱スペクトル (SSD) (赤線)。
SSDは、プラズモンの多重散乱強度の除去 (矢印①) およびゼロロスピーク強度を除去 (矢印②) することによって得たスペクトルである。
点線は本文中の (1) 式を用いて導出したRe[1/ε(ω)]である。(c) 末文中 (付録2) の (2)、(3) 式を用いて得た誘電関数の実部ε1(ω) (赤線) と虚部ε2(ω) (青線)。
光学的に得られたスペクトルとの比較
求めた誘電関数 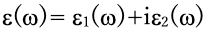 から、複素屈折率
 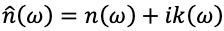 (屈折率n (ω)、消衰係数k(ω) )、反射率R(ω)、光吸収係数μ(ω) を計算して、光学実験で求められた値と比較することができる (光学的性質については付録2を参照)。EELSスペクトルから導出した誘電関数を使って求めた反射スペクトルを図2 (a) に示す。この反射スペクトルの7 eV, 13 eV, 21 eVのスペクトル構造は、光学測定[4]で得られるスペクトル構造 (図2 (b) ) とよく一致している。この結果はEELSを用いて光学的性質が測定できることを示している。
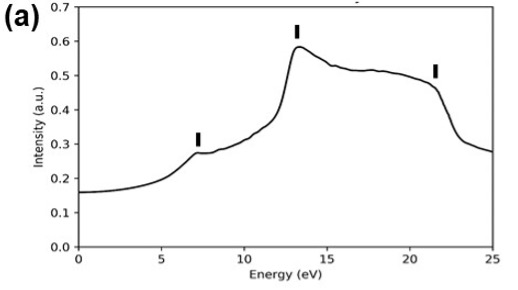
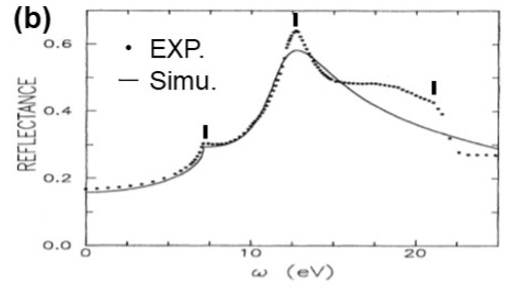
図2. (a) EELSから導出した誘電関数を用いて計算した反射スペクトル。 (b) 点線は光学測定によって得られた反射スペクトル[4]。
実線は、仮定したバンド構造から計算した反射スペクトルである。
図 (a) のEELSから導出した反射スペクトルは、図 (b) の光学測定の結果とよく一致している。
(東北大学多元物質科学研究所 准教授 佐藤庸平 執筆)
参考文献
- [1] F. Wooten, "Optical properties of solids", Academic press INC. (1972).
- [2] 渡辺誠、佐藤繁 「放射光科学入門」、東北大学出版会
- [3] R. F. Egerton, Electron Energy-Loss Spectroscopy in the Electron Microscope
- [4] A. D. Papadopoulos, Phys. Rev. B, 43, 5090 (1991).
https://doi.org/10.1103/PhysRevB.43.5090
付録1: SSDの規格化
ISSD(ω) の規格化の方法として、Sum-rule法を用いた例を示す。材料の価電子密度Nが分かっているとき、以下の関係式を用いてISSD(ω) を規格化する。
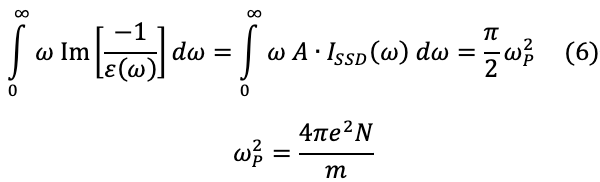
ここで、Aは規格化定数、ωpはプラズマ角振動数、eは電子の素電荷、mは電子の質量である。(6) の第2式と第3式からAが決まる。A・ISSD(ω) = Im[-1/ε(ω) ]から損失関数が求まる。
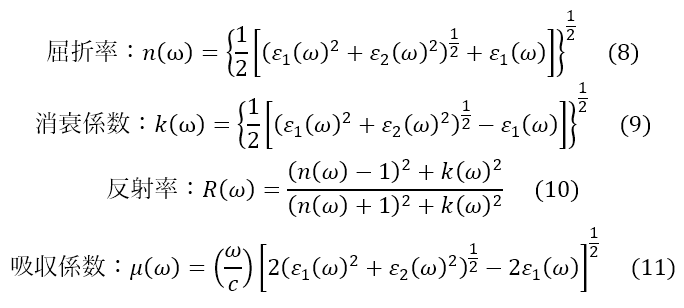
付録2: 誘電関数と各光学的性質との関係式
誘電関数ε(ω) =ε1(ω) + iε2(ω) と光学的性質との関係を以下に示す。
A spectrum of electron energy-loss spectroscopy (EELS) gives the imaginary part of the reciprocal of the dielectric function 1/ ε(ω). When the Kramers-Kronig relation is applied to the imaginary part, the real part of 1/ ε(ω) is obtained. The complex dielectric function ε(ω)=ε1(ω) + iε2(ω) is derived from the obtained real and imaginary parts of 1/ ε(ω) using algebraic calculations. The method to derive ε(ω) = ε1(ω) + iε2(ω) from the imaginary part of 1/ ε(ω) is called "Kramers-Kronig analysis (KK analysis)". Since the complex dielectric function provides the optical properties (refractive index, reflectance and optical absorption) of materials, KK analysis is an essential method to obtain the optical properties of materials from the EELS spectrum.
Procedure of Kramers-Kronig analysis in EELS
The procedure to obtain the complex dielectric function ε(ω) from an EELS spectrum of diamond using KK analysis is described below.
- 1 ) The multiple scattering intensity of plasmon (the collective oscillation of the whole valence electrons) is removed from the EELS spectrum of diamond (black line in Fig. 1(a)) by using the Fourier-log deconvolution method, as indicated with arrow ①.
- 2 ) The tail of the zero-loss peak at an energy range of 0-2 eV is removed (arrow ② in Fig(a)). Two methods are used to remove the tail; one is to directly measure the zero-loss intensity distribution without inserting a specimen, and the other is to reproduce the intensity distribution using a certain mathematical function for fitting.
- 3 ) The spectral intensities which are scattered outside the acceptance angle of the analyzer are corrected. It is noted that the inelastic scattering of electrons is almost forward scattering, but part of inelastic scattering goes out of the acceptance angle of the analyzer.
The spectrum subjected to the corrections of 1) to 3) is called "single scattering spectrum distribution (SSD)". - 4 ) The SSD intensity ISSD(ω) is normalized to derive the loss function Im[-1/ ε (ω)] (solid line in Fig. 1(b)). For the normalization of ISSD(ω), the Sum-rule method (Appendix 1) is applied, which is based on the fact that the spectral intensity is proportional to the number of electrons in a solid.
- 5 ) Using the Kramers-Kronig relation (equation 1) (described below), Re[1/ ε (ω)] is derived from Im[-1/ ε (ω)] (dotted line in Fig. 1(b)).
- 6 ) Finally using algebraic equations (2) and (3) (described below), the dielectric function ε (ω) is derived (Fig. 1(c)).
Kramers-Kronig relation
The Kramers-Kronig relation (The relation between the real and imaginary parts of the frequency response function in the linear response theory) is used to obtain the real part of the complex dielectric function Re[ε (ω)] from the imaginary part of the function Im[ε (ω)], the imaginary part being obtained by spectroscopic measurements [1, 2]. Similarly, from the loss function Im[–1/ ε (ω)] obtained by an EELS spectrum, Re[1/ ε (ω)] is derived using the following equation (1) or the Kramers-Kronig relation.
Here, Re and Im represent respectively the real and imaginary parts of the complex function. ω represents the angular frequency. P is called "principal value of Cauchy's integral", which means the integral except for the pole ω = ω'. The integral of the angular frequency is performed from 0 to infinity but the energy range of the measured EELS spectrum is limited less than 100 eV. Thus, for calculating equation (1), the spectrum is extrapolated up to 400-500 eV.
From Re[1/ ε (ω)] and Im[-1/ ε (ω)], the real part ε1(ω) and the imaginary part ε2(ω) of the complex dielectric function are calculated using the following algebraic equations (2) and (3).
What are revealed from the dielectric function
From the derived dielectric function (Fig. 1(c)), the followings are revealed.
- 1 ) The real part ε1(0) of the dielectric function at ħω=0 eV derived from the EELS measurement, that is, the dielectric constant of diamond is ε=5.7. The value is in good agreement with an optical measurement result.
- 2 ) It is seen that the plasmon excitation conditions, ε1(ω)~0 and ε2(ω)<<1 are satisfied at an energy of ħω=34 eV. The volume plasmon peak is observed in the EELS spectrum at the energy.
- 3 ) ε1(ω) shows a strong resonance-type dispersion at 12 eV. This corresponds to an interband transition. At this event, a strong spectral peak (blue peak) in the imaginary part ε2(ω) appears due to an energy absorption by the transition. This interband transition is the transition from the bonding orbital σ to the anti-bonding orbital σ* of the sp3 electron orbital. A weak absorption due to the transition from the 2p bonding orbital to the 2s anti-bonding orbital is seen at approximately 7 eV, showing a weak dispersion of ε1(ω) and a weak absorption of ε2(ω) (vertical dotted line).
- 4 ) At 5.5 eV (inverted triangle ▼), the onset in the intensity of ε2(ω) is seen. This corresponds to an indirect transition between the two energy bands, which needs phonon excitations. Thus, this absorption is weak compared with the absorption due to the direct transition.
It should be noted that a shoulder at 7 eV and a peak at 12 eV in the imaginary part ε2(ω) due to energy absorptions are not clearly observed in the EELS spectrum (Fig. 1(a)). Those structures are elucidated only when the EELS spectrum is transformed to the imaginary part ε2(ω) of the dielectric function by KK analysis.
On the other hand, the spectrum of ε2(ω) obtained by optical measurement does not provide the plasmon peak. The advantage of EELS is that plasmons can be observed directly. Furthermore, the band gap energy can be measured directly from the onset energy of the EELS intensity (inverted triangle ▼ in Fig. 1(a)) without KK analysis, and also agrees with the onset ofε2(ω) (inverted triangle ▼ in Fig. 1(c)).
Fig. 1 (a) Experimental EELS spectrum of diamond (black line) and the single scattering distribution (SSD) (red line).
SSD is the spectrum obtained by removing both the multiple plasmon scattering intensity (arrow ①) and the zero-loss peak intensity (arrow ②).
(b) The solid line represents the loss function Im[-1/ ε (ω)] which is obtained by normalizing the SSD.
A dotted line represents Re[1/ ε (ω)] derived by using equation (1). (c) The real part ε1(ω) (red line) and the imaginary part ε2(ω) (blue line) of the obtained dielectric function using equations (2) and (3) described in Appendix 2.
Comparison with a spectrum obtained by an optical measurement
From the obtained dielectric function , the complex refractive index (refractive index n(ω) and extinction coefficient k(ω)), reflectance R(ω) and optical absorption coefficient μ(ω) can be calculated. Those values can be compared with the values obtained by optical measurements (optical properties refer to Appendix 2).
Fig. 2 (a) shows the reflection spectrum calculated from the dielectric function derived from the EELS spectrum. The spectral structures at 7 eV, 13 eV and 21 eV of this reflection spectrum are in good agreement with the structures obtained by an optical measurement (Fig. 2(b)) [4]. This demonstrates that the optical properties can be derived correctly from the EELS spectrum.
Fig. 2 (a) Reflection spectrum calculated by using the dielectric function derived from an EELS spectrum.
(b) The dotted line shows a reflection spectrum obtained from an optical measurement [4].
The solid line shows a reflection spectrum calculated with a band structure assumed. The reflection spectrum derived from EELS (Fig.(a)) is in good agreement with that of the optical measurement (Fig.(b)).
(By Associate Professor Yohei Sato, Tohoku University)
References:
- [1] F. Wooten, "Optical properties of solids", Academic press INC. (1972).
- [2] M. Watanabe, S. Satoh, "Introduction to Synchrotron Radiation science", Tohoku University Press (in Japanese).
- [3] R. F. Egerton, Electron Energy-Loss Spectroscopy in the Electron Microscope
- [4] A. D. Papadopoulos, Phys. Rev. B, 43, 5090 (1991).
https://doi.org/10.1103/PhysRevB.43.5090
Appendix 1: Normalization of SSD
An example of normalization of ISSD(ω) to use the Sum-rule method is presented.
When the density of valence electrons N of a material is known, ISSD(ω) is normalized by using the following equation.
Here, A is the normalization constant, ωp is the angular frequency of the plasmon, e is the charge of an electron, and m is the mass of the electron. A is determined from the second and third terms of eq. (6). The dielectric function is derived from the equation A・ISSD(ω)=Im[-1/ ε(ω)].
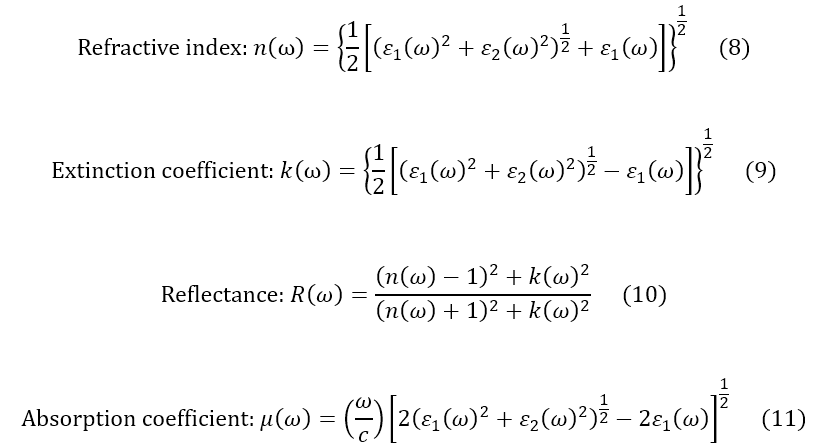
Appendix 2: Relations between the dielectric function and optical properties
The relations between the dielectric function ε (ω)=ε1(ω)+iε2(ω) and the optical properties are shown as follows.
関連用語から探す
説明に「クラーマス・クローニッヒ解析」が含まれている用語


