フーリエシェルコリレーション
フーリエシェルコリレーション
Fourier Shell Correlation, FSC
[目次:画像処理(画像処理/波形処理)]
フーリエ シェル コリレーション(Fourier Shell Correlation/FSC)とは、単粒子解析により得られた生体分子の立体構造の信頼度を空間周波数ごとに表す指標であり、以下の式(正規化相互相関)を用いて求められる。
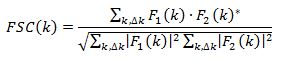
ここで、F1(k)とF2(k)はそれぞれ、評価する構造について任意の独立な2セットのTEM像から再構成された2つの構造の三次元フーリエ変換。F2(k)*はF2(k)の複素共役、Σk,ΔkF(k)は、F(k)をkに関する小区間Δkにわたって加算したものである。
FSC(k)は、すべての空間周波数kにわたって+1から–1の間の値をとり、+1に近いほど二つの構造の一致度が高いことを示す。そして、独立な2セットのデータから再構成された構造の一致度が高い(+1に近い)とき、その構造の信頼度が高いとする。また、FSCの周波数特性が単調減衰(空間周波数kが大きくなるとき0に向かって一様減衰)しない場合は、FSC関数の信頼性が低いと判断される。
以下に、マウス由来のアポフェリチンの場合のFSC(k)と空間分解能を例として示す。
単粒子解析のために取得したTEM像のデータセットを無作為に2つに分け、別々に完全に独立な画像解析を行い2つの三次元構造を得る。得られた2つの三次元構造からFSCを計算する。
図1(a)に840枚のTEM像から抽出された120,295粒子を用いて再構成されたアポフェリチンの一つの三次元密度マップを、図1(b)に、この三次元密度マップについて計算したFSCを示す。このFSCの周波数特性は、周波数の小さい部分では+1に近く、周波数の増大とともにゼロに向かって一様に減衰している。このことから、FSC関数の信頼性は確保されていると判断される。
単粒子解析では、その分解能をFSC = 0.143となる空間周波数の逆数とすることが一般的である。(0.143という値は、ランダムノイズのコリレーションについての統計的な考察とX線構造解析で定義された分解能との比較を基にして採用された値である)
FSC = 0.143を示す空間周波数の値6.5nm-1から分解能は0.153nmと見積もられた。
(大坂大学 難波啓一特任教授 校閲)
図1 単粒子解析により得られたマウス由来のアポフェリチンの三次元密度マップとそのFSC。
(a) アポフェリチンの三次元密度マップ。 ⇒ (a)
(b) 得られた2つの三次元密度マップから計算したFSC関数。FSC = 0.143を示す空間周波数の値6.5nm-1から、分解能は0.153nmと見積もられた。⇒ (b)
Fourier Shell Correlation (FSC) is a measure of reliability of the three-dimensional (3D) structures of biological macromolecules obtained by “single particle analysis”. FSC is expressed as a function of spatial frequency by the following equation (normalized cross correlation).
Here, F1(k) and F2(k)are 3D Fourier transforms of the two structures reconstructed from arbitrary two independent sets of TEM images obtained. F2(k)* is a complex conjugate of F2(k), and Σk,ΔkF(k) means summing up F(k) over a small range Δk around k.
FSC (k) takes a value between +1 and –1 for every spatial frequency k. The value of FSC (k) close to +1 means that the two reconstructed structures agree well, indicating a high degree of reliability of the obtained structure. If FSC does not decrease monotonically with spatial frequency k at high frequencies, the reliability of the FSC function is considered to be low.
The following example shows the FSC and spatial resolution for mouse apoferritin.
First, a data set of TEM images acquired for single particle analysis is randomly divided into two groups, and two independent 3D structures are obtained by image-processing analysis for each group. FSC is calculated using the two obtained 3D structures.
Fig. 1(a) shows a 3D density map of apoferritin reconstructed from 120,295 particles extracted from 840 cryo-TEM images. Fig. 1(b) is the FSC calculated for this 3D density map. The values of FSC at low frequencies are close to +1 and damped with increasing frequency monotonically towards 0. This behavior confirms high reliability of the FSC function.
In single particle analysis, it is common to define the spatial resolution of the obtained structure to be the reciprocal of the spatial frequency at which FSC = 0.143. (The value “0.143” is a value adopted based on statistical discussion about the correlation of random noise and on referring the resolution defined for X-ray crystallography.) The resolution for apoferritin was determined to be 0.153 nm from a spatial frequency of 6.5 nm-1 at which FSC takes a value of 0.143.
(Proofread by Specially Appointed Professor Keichi Namba, Osaka University)
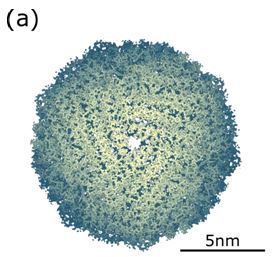
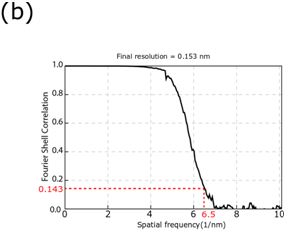
Fig. 1
3D density map of mouse apoferritin obtained by single particle analysis and its FSC. (a) 3D density map. (b) An FSC function calculated from the two 3D density maps. The resolution was determined to be 0.153 nm from a spatial frequency of 6.5 nm-1 at which FSC = 0.143.
説明に「フーリエシェルコリレーション」が含まれている用語


