運動量移送分解電子エネルギー損失分光法
運動量移送分解電子エネルギー損失分光法
momentum transfer resolved electron energy-loss spectroscopy, q-EELS
[目次:分光分析(EELS/EDS/電子構造)]
高速電子が固体に入射し、物質中の電子および原子核とのクーロン相互作用によってエネルギーを失った非弾性散乱電子は、物質中の電子や原子核に運動量qを与え、自身はエネルギーを失って-q方向に散乱される。このように散乱された非弾性散乱電子を、エネルギー損失量だけでなく、運動量移送qの関数として分光する測定手法を、運動量移送分解電子エネルギー損失分光法(q-EELS)または角度分解EELS(AR-EELS)法と呼ぶ。
q-EELS測定は、バンド間遷移(0~10eV)の測定では損失関数から誘電関数のq依存性 ε(q,ω)を、プラズモン振動(10~50eV)の測定では結晶方位依存性(q依存性)を得ることができる。内殻電子励起スペクトル(50eV~)のq分解測定では、誘電関数の虚部ε2 (q,ω)が求まり非占有電子軌道の空間配向の状態がわかる[1,2]。
q-EELSの測定
Ωフィルターを用いたq-EELS測定の例を図1に示す。電子顕微鏡を回折モードに設定する。すなわち、対物レンズによって試料の回折図形の拡大図がスリットを挿入する面上に作られる。この面はΩフィルターの物面になっている。スリットによってスリットに垂直な方向のqを制限する(図では3個の回折スポットO, Gおよび-Gが取り込まれている)。このとき、スリットの長手方向は、分光器(Ωフィルター)のエネルギー分散がない方向に設定する。これらの回折スポットをΩフィルターに通すと、スリットに垂直な方向にエネルギー分散を起こし、スリットに平行な方向のqの関数としてエネルギー損失分光(EELS)スペクトルが得られる。すなわち、分光器を通った非弾性散乱電子は、運動量移送qを横軸として、エネルギー損失量Eを縦軸にして二次元的に表示される。つまり、E-qマップが得られる。
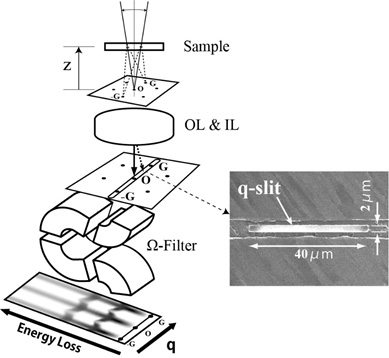
図1. 分光器としてΩフィルターを用いたq-EELS測定の概念図。
Ωフィルターの物面に電子回折図形を結像し、スリットを挿入してスリットに垂直な方向のqを制限する(この図では、透過波O,反射はGおよび-Gが取り込まれている)。分光器を通過した非弾性散乱電子は像面に、エネルギー損失量(スリットに垂直な方向)を運動量移送量q(スリットに平行な方向)の関数として二次元表示される。
アルミニウムの体積プラズモンのq依存性
図2にアルミニウムから測定したE-qマップを示す。q=0 Å-1でのエネルギーロスがゼロの強度は本来の透過スポットに対応する。q=0 Å-1でエネルギーロス15eVの強度はアルミニウムの体積プラズモンに起因するものである。体積プラズモンによるスペクトルが、q=0 Å-1でエネルギーロス15eV の位置からqの増加とともに放物線状に伸びているのが見られる。このことは、体積プラズモンエネルギーがqの増加とともにq2に比例して増加していることを示しており、アルミニウム中の伝導電子は、自由電子ガスのように振舞うことを表している([付録1]を参照)。q=±3.1 Å-1の002()反射の位置には、q=0 Å-1と同様のエネルギー分散が観察されている。
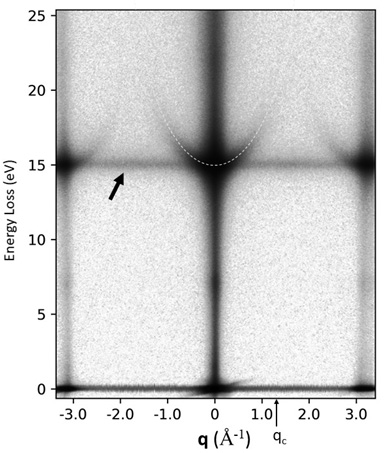
図2. アルミニウムのE-qマップ。
q=0 Å-1およびq=±3.1 Å-1でのエネルギー損失15eVの周りに、q2に比例するプラズモンエネルギーの(白い点線に沿った強度)が観察されている。qc=1.3Å-1はアルミニウムの体積プラズモンでの臨界運動量移送を表し、|q| > qc でプラズモン強度は消失する。そのほかに、qに依存しない15eVの強度(黒矢印)は、体積プラズモンといろいろなqを持つ格子振動による多重散乱強度である。詳細は[付録1]に記述した。
q-EELS測定は、異方的な金属材料のプラズモンエネルギーの振動方向依存性の解析に用いられる([付録2]を参照)[3]。また、金属と誘電体界面の表面(界面)プラズモンエネルギーのq依存性の測定や、周期的な界面構造を有するプラズモニクス材料中のプラズモンエネルギーのq依存性の解析に用いられている [4, 5]。
このほかに内殻電子励起スペクトルのq依存性の測定では、非占有電子軌道の方位の同定に応用されている[1, 2]。さらに近年エネルギー分解能が数十meVまで向上し、赤外領域の測定が可能になってきている。そのエネルギー領域では、格子振動エネルギーのq依存性の測定が可能で、局所領域でのグラファイトやグラフェンのフォノンのq分散が報告されている[6]。
(東北大学多元物質科学研究所 准教授 佐藤庸平 執筆)
文献
[1] K. Saitoh, K. Momonoi, N. Tanaka, and S. Onari, J. Electron Microsc. 55, 281-288 (2006).
[2] K. Saitoh, K. Momonoi, N. Tanaka, and S. Onari, J. Appl. Phys., 112, 113920 (2012).
[3] Y. K. Sato et al., J. Appl. Phys., 126, 185107 (2020)
[4] H. Saito and H. Kurata, J. Appl. Phys., 117, 133107 (2015)
[5] H. Saito et al., Phys. Rev. B, 100, 245402 (2019).
[6] R. Senga, K. Suenaga, P. Barone, S. Morishita, F. Mauri, and T. Pichler, Nature, 573, 247-250 (2019).
[付録1]
体積プラズモンエネルギーのq依存性
プラズモンエネルギーのq依存性は、金属中の電子が自由電子ガスのように振る舞うならば、次式で与えられる。
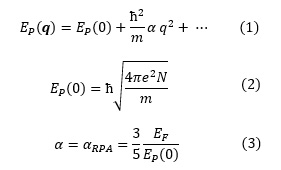
ここで、ħ=h ⁄ 2π:プランク定数、m:電子の質量、e:素電荷、N:電荷密度である。αはプラズモンの分散係数と呼ばれる。EFは金属のフェルミエネルギー、EP(0)は q=0のときのプラズモンエネルギーである。
金属中の自由電子全体は密度一定のまま、原子核による一様な正電荷に対して変位し、その変位によって金属表面に誘起される電荷のクーロン力を復元力として自由電子全体が振動する。これがq=0のときのプラズモンである。運動量qを持つプラズモンとは、qの方向に波長∝1/|q|をもつ電荷疎密波である。式(1)から分かるように、プラズモンエネルギーがq2に比例して増加する。q値が大きくなるにつれて電荷の疎密の間隔(波の波長)が小さくなり、電荷密度が局所的に増大する。これが、qの増加にともなってプラズモンエネルギーが増加する理由である。
qが増加し臨界値(qc)を超えると、プラズモンは急速に減衰し消失する。すなわち、q > qcでは、電子が集団で励起されるのでなく、個々の電子が伝導電子帯バンド内の非占状態へ励起(バンド内遷移)されるようになり、集団励起としての電荷疎密波は崩壊する。アルミニウムのqcは1.3 Å-1と見積られており、その位置でプラズモン強度が消失する様子が図2にみられる。
[付録2]
体積プラズモンエネルギーの異方性の観測
プラズモンエネルギーのq2分散の係数αは、金属バンドの構造を決める電荷密度Nや有効質量mに依存している。異方的な結晶構造をもつ金属材料では、有効質量mが結晶の方位で異なっており、プラズモンの分散関係も結晶方位で異なっている。
図3(a)は、低密度のキャリア電子(5.4×10²¹ e/cm3)をもつ六方晶Cs0.33WO3(CWO)の結晶構造である。キャリア電子は1価のCs原子から電子が供給される。図3(b),(c)は、その結晶から0~3 eVの範囲で測定したq-EELSスペクトルである。図3(b)は q// (ab面内の方向)の、図3(c)は q//0001 (c軸方向)のq依存性を示している。q=0 Å-1のスペクトルに見られるピークA (1.2 eV)は CWOのキャリア電子による[]方向に振動する体積プラズモンであり、ピークB (1.8eV)は[0001]方向に振動する体積プラズモンである。プラズモンのエネルギーが、振動の方向が[0001]方向のときに、振動の方向が[]方向のときよりも高いことを示している。CWO結晶のキャリア電子の有効質量が[0001]方向で小さく、[]方向で大きいことが知られているので、(2)式より[0001]方向のプラズモンは[]方向よりもエネルギーが高いことが理解できる。
q//のスペクトル(図3 (b))では、[]方向に振動する体積プラズモンのピークA(1.2 eV)が主に観測される。ただし、q=0 Å-1の近くでは[0001]方向に振動する体積プラズモンであるピークB(1.8 eV)も観測される。 q//0001のスペクトル(図3 (c))では、[0001]方向に振動する体積プラズモンのピークB(1.8 eV)が主に観測される。同様に、q=0 Å-1の近くでは[]方向に振動する体積プラズモンのピークB(1.8 eV)も観測される。このように異方性のある金属に対して、異なるq方向に振動するプラズモンのエネルギーの違いを測定することができる。
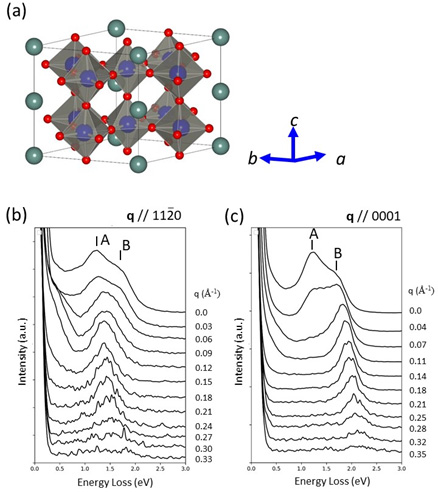
図3 (a) 六方晶Cs0.33WO3結晶構造。
1価のCs原子から電子が供給され、系全体では電荷密度n=5.4×10²¹ e/cm3のキャリア電子を有する金属である。 (b) q// (ab面内の方向) の体積プラズモンのq依存性。(c) q//0001 (c軸方向)の体積プラズモンのq依存性。異方性のある金属では、体積プラズモンエネルギーはqの方向によって異なっているので、体積プラズモンの異方性を測定できる。
When highly accelerated electrons are incident on a solid substance, certain electrons are scattered and lose a part of their energies by the Coulomb interactions with the electrons and the atomic nuclei in the substance. These electrons, called inelastically scattered electrons, give a momentum q to the electrons or the atomic nuclei in the substance and are scattered in the direction -q against the incident electron beam. The spectroscopic method to obtain the energy loss spectra of those inelastically scattered electrons as a function of momentum transfer q as well as energy loss values is named "momentum transfer resolved electron energy-loss spectroscopy" (momentum transfer resolved EELS) or q-EELS. The method is also called "angle resolved EELS" (AR-EELS).
The q-EELS measurement of the interband transitions (0 to 10 eV) reveals the q dependence of the dielectric function ε(q,ω) through the loss function. The crystal orientation dependence (q dependence) of plasmon oscillations can be obtained in the measurement of plasmon loss (10 to 50 eV). The q-resolved measurement of the core-loss spectrum(50 eV or higher)determines the imaginary part ε2 (q,ω) of the dielectric function, revealing the spatial orientation of the electron orbitals of the unoccupied states [1, 2].
Measurement of q-EELS
Fig. 1 shows an example of q-EELS measurement using an omega (Ω) energy filter. A transmission electron microscope (TEM) is set to the diffraction mode. That is, with the action of the objective lens, the enlarged image of the diffraction pattern of the specimen is formed on the plane where a slit (q-slit) is inserted. This plane is the object plane of the omega filter. The inserted slit limits "q" in the vertical direction against the slit. (In Fig. 1, three diffraction spots of O, G and -G are accepted.) Here, the longer direction of the slit is set in the direction where no energy dispersion of an analyzer (omega filter) takes place. When these diffraction spots pass through the omega filter, the energy dispersion of the inelastically scattered electrons occurs in the direction vertical to the slit. Then, the EELS spectrum is obtained as a function of q in the longer direction of the slit. That is, the inelastically scattered electrons which pass through the analyzer are two-dimensionally displayed as an E-q map, in which the momentum transfer q is taken as the horizontal axis and the energy loss E is taken as the vertical axis.
Fig. 1. Schematic of q-EELS measurement using an omega energy filter as an analyzer.
An electron diffraction pattern is formed on the object plane of the omega filter. A slit is inserted onto the diffraction plane to limit q in the direction vertical to the slit. (In Fig. 1, a transmission wave O, and the reflections G and -G are accepted.) The inelastically scattered electrons which pass through the analyzer (omega filter) are two-dimensionally displayed as an E-q map, in which the energy loss E appears in the direction vertical to the slit and the momentum transfer q appears in the direction parallel to the slit.
q dependence of the volume plasmon of aluminum (Al)
Fig. 2 shows an E-q map obtained from EELS measurement of aluminum (Al). The intensity of zero-loss energy at q=0 Å-1 corresponds to the original transmission spot. The intensity of an energy loss 15 eV at q=0 Å-1 is caused by the volume plasmon of Al. The spectrum due to the volume plasmon is seen to extend with a parabolic shape with increasing q from the position of an energy loss 15 eV at q=0 Å-1. This shows that the volume plasmon energy increases in proportion to q2 with increasing q. Thus, the result indicates that the conduction electrons in Al behave like free electron gases (refer to Appendix 1). At the positions of the 002 and reflections at q= ±3.1 Å-1, the same energy dispersions are seen as that observed at q=0 Å-1.
Fig. 2. E-q map of Al.
The plasmon energy intensities increasing in proportion to q2 (indicated by white dashed line) are observed around an energy loss of 15 eV at q = 0 Å-1 and at q = ±3.1 Å-1. The plasmon intensity vanishes for q > qc = 1.3 Å-1, where qc is the critical momentum transfer of the volume plasmon of aluminum. The intensity at 15 eV independent of q (indicated by black arrow) is due to multiple scatterings of the volume plasmon and lattice vibrations with different q. Details are given in [Appendix 1].
q-EELS measurements are used to analyze the dependence of plasmon energy on the direction of oscillation in anisotropic metallic materials (refer to Appendix 2) [3]. q-EELS measurements have also been applied to the q dependence of the surface (interface) plasmon energy of the interface between a metal and a dielectric material, and to that of a plasmonic material with a periodic interface structure [4, 5].
In measurement of the q dependence of the core-loss spectrum, q-EELS measurements have been applied to identification of the directions of the electron orbitals of the unoccupied states [1, 2].
In recent years, the energy resolution of EELS has been improved up to a few tens of meV, making it possible to measure EELS spectra in the infrared region. In this energy region, it is possible to measure the energy of the lattice vibrations (phonon), and the q-dispersion spectra of the phonons in the local regions of graphite and graphene have been reported [6].
(By Associate Professor Yohei Sato, Tohoku University)
References
[1] K. Saitoh, K. Momonoi, N. Tanaka, and S. Onari, J. Electron Microsc. 55, 281-288 (2006).
[2] K. Saitoh, K. Momonoi, N. Tanaka, and S. Onari, J. Appl. Phys., 112, 113920 (2012).
[3] Y. K. Sato et al., J. Appl. Phys., 126, 185107 (2020)
[4] H. Saito and H. Kurata, J. Appl. Phys., 117, 133107 (2015)
[5] H. Saito et al., Phys. Rev. B, 100, 245402 (2019).
[6] R. Senga, K. Suenaga, P. Barone, S. Morishita, F. Mauri, and T. Pichler, Nature, 573, 247-250 (2019).
Appendix 1
q dependence of volume plasmon energy
The q dependence of the volume plasmon energy is given by the following equations, if the electrons in a metal behave like free-electron gases.
Here, ħ=h ⁄ 2π is Planck constant. The parameters of m, e, N respectively express the mass of an electron, the elementary charge of an electron, and the charge density. α is called the dispersion coefficient of the plasmon. EF is the Fermi energy of a metal and EP(0) is the plasmon energy at q = 0.
When the entire free electrons are displaced collectively (without density change) against a uniform positive charge formed by the atomic nuclei in the metal, the displaced electrons induce charges on the metal surfaces to produce the Coulomb force. The Coulomb force acts as the restoring force to the electrons and causes the oscillation of the free electrons. This is the volume plasmon at q = 0.
The plasmon with momentum q ≠ 0 is a charge compressional wave having a wavelength ∝1/|q| in the direction of q. As is seen from equation (1), the plasmon energy increases in proportion to q2. As the q value becomes large, the wavelength of the charge compressional wave becomes small, and then, the charge density increases locally. This is the reason why the plasmon energy increases with increasing q. As q increases and exceeds the critical value (qc), the plasmon rapidly decays and disappears. That is, for q > qc, instead of electrons being excited collectively, electrons are individually excited to the unoccupied states in the conduction band (intra-band transitions), and the charge compressional wave as a collective excitation disappears. The qc of aluminum is estimated to be 1.3 Å-1, and vanishing of the plasmon intensity at the qc is seen in Fig. 2.
Appendix 2
Observation of the anisotropy of volume plasmon energy
The coefficient α of q2 dispersion of the plasmon energy of a metal depends on the charge density N and the effective mass m, which determine the band structure. In a metallic material having an anisotropic crystal structure, the effective mass m differs in the different crystal orientations. Thus, the dispersion relation of the plasmon also differs in the different crystal orientations.
Fig. 3(a) shows the crystal structure of the hexagonal crystal of Cs0.33WO3 (CWO) having low-density carrier electrons (5.4 Χ 1021 e/cm3). The carrier electrons are supplied by the monovalent Cs atoms.
Fig. 3(b) and (c) show its q-EELS spectra over an energy region between 0 and 3 eV. Fig. 3(b) is the spectra measured in a direction q// (a direction of the ab plane), and Fig. 3 (c) is those in a direction q//0001 (c axis direction). The peak A (1.2 eV) in the spectrum at q = 0 Å-1 is a volume plasmon oscillating in the[]direction due to the CWO carrier electrons, and the peak B (1.8 eV) is a volume plasmon oscillating in the [0001] direction. The plasmon energy is larger when the oscillation direction is in the [0001] direction than when the oscillation direction is in the[]direction. Since the effective mass of the carrier electrons in the CWO crystal is known to be small in the [0001] direction and large in the[]direction, it is understood from equation (2) that the plasmon energy in the [0001] direction is larger than that in the[]direction.
The spectrum of q// (Fig. 3 (b)) is a volume plasmon oscillating in the [] direction and shows mainly the peak A (1.2 eV).
In the spectrum of q// (Fig. 3 (b)), the peak A (1.2 eV) of the volume plasmon oscillating in the [] direction is mainly observed. However, the peak B (1.8 eV), which corresponds to the volume plasmon oscillating in the [0001] direction, is also observed near q = 0 Å-1. In the spectrum of q//0001 (Fig. 3 (c)), the peak B (1.8 eV) of the volume plasmon oscillating in the [0001] direction is mainly observed. Similarly, the volume plasmon peak A (1.2 eV) oscillating in the [] direction is also observed near q = 0 Å-1. As a result, the difference in the energy of plasmons oscillating in different q directions can be measured.
Fig. 3 (a) Crystal structure of hexagonal Cs0.33WO3.
The carrier electrons are supplied from the monovalent Cs atoms. Cs0.33WO3 is a metal having carrier electrons with a density of n = 5.4 Χ 1021 e/cm3. (b) The q dependence of the volume plasmon measured along q// (a direction in the ab plane). (c) The q dependence of the volume plasmon measured along the direction of q//0001 (c axis direction). For the anisotropic metallic materials, the energy of the volume plasmon is different for the different direction of the momentum transfer q. Thus, the anisotropy of the volume plasmon can be measured.
関連用語から探す
説明に「運動量移送分解電子エネルギー損失分光法」が含まれている用語


