定性分析
定性分析
qualitative analysis
[目次:分析]
試料から放出された特性X線のエネルギーまたは波長から、試料を構成する元素を同定する分析。特性X線のエネルギースペクトルを用いる場合をEDS(Energy Dispersive X-ray Spectroscopy)といい、波長スペクトルを用いる場合をWDS(Wavelength Dispersive X-ray Spectroscopy)という。
分析モードとして、試料上の一点に電子ビームを止めて特性X線のスペクトルから含まれる元素を求める点分析、目的とする元素が指定した線上にどのように分布しているかを表示する線分析、目的とする元素が指定した面内でどのように分布しているかを表示する面分析(元素マッピング)がある。
EDSでは、短時間にしかも簡便に定性分析を行うことができる。ただし、エネルギー分解能はマンガン(Mn)のKα(5.9keV)に対して定義され128~140eVである。そのためエネルギー値が分解能に近い複数の元素のピークが互いに重なり合う。例えば、ストロンチウム(Sr)のLα(1.806keV)とケイ素(Si)のKα(1.739keV)のピークは重なり合う。下表に、主要元素からのKα線とそれに近接する他元素からの特性X線を示す。
このような場合、WDSを用いれば、それらの元素からのピークを分離して検出できる。WDSのエネルギー分解能は、波長をエネルギー換算すると、10~20eVと非常に高いからである。また、EDSでは含有量が10分の数%以下の微量元素はピークとして認識できないため、定性分析で同定することができない(検出限界)。WDSを用いると1000分の数%の微量元素まで検出できる。
なお、EDS、WDSともに、試料に入射する電子ビーム径が小さくても、X線の発生領域は数100nm~数μm程度になる。
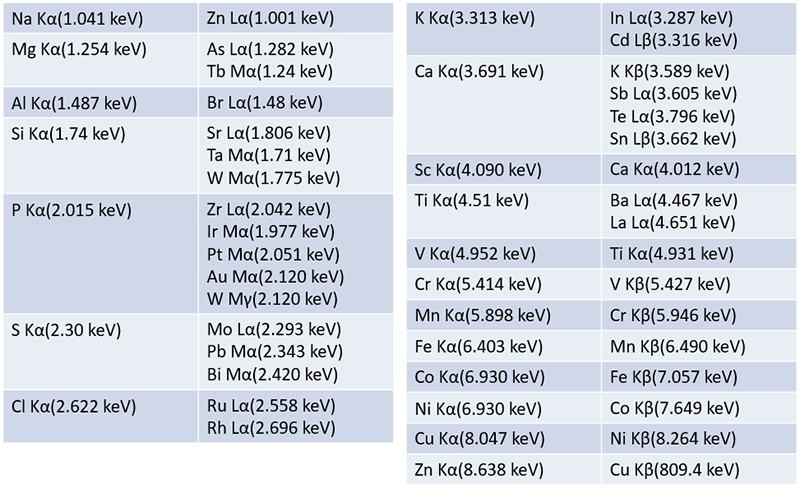
表 特性X線のピークの重なり
Qualitative analysis means to identify constituent elements of a specimen from the energy or wavelength of characteristic X-rays emitted from the specimen. The method to measure the energy is termed EDS (Energy Dispersive X-ray Spectroscopy) and the method to measure the wavelength is termed WDS (Wavelength Dispersive X-ray Spectroscopy).
Analysis modes of qualitative analysis include 1) Point analysis that reveals constituent elements obtained from the acquired X-ray spectra from one point of the specimen, 2) Line analysis that displays the distribution of elements of interest on a specified line of the specimen, and 3) Area analysis (elemental mapping) that displays the distribution of elements of interest over a specified specimen area.
EDS provides fast and easy qualitative analysis. Its energy resolution is 128 to 140 eV (defined at manganese (Mn) Kα 5.9 keV). Then, spectral peaks sometimes overlap to each other, when the energies of the two peaks from different elements are close to the resolution of EDS. For example, the peak of strontium (Sr) Lα (1.806 keV) overlaps with that of silicon (Si) Kα (1.739 keV). Table below shows the energies of Kα lines from the major elements and those of characteristic X-rays from other elements close to them.
It should be noted that the use of WDS enables to avoid such peak overlap and to observe the peaks clearly separated because the energy resolution of WDS is as high as10 to 20 eV (wavelength is converted to energy). Another advantage of WDS is that trace element of very small amounts, down to 0.002 or 0.003% can be detected, though EDS cannot detect the trace elements less than a few tenths of a percent (e.g. 0.2%) as peaks (detection limit), so they cannot be identified by qualitative analysis (detection limit).
It is noted that in both EDS and WDS, the X-ray generation region reaches several 100 nm to several μm in size, even when the diameter of the incident electron beam is small.
Table. Energies of Kα lines of the major elements and those of characteristic X-rays from other elements close to them.
関連用語から探す
説明に「定性分析」が含まれている用語


